A price-wage loop on the Christmas tree?
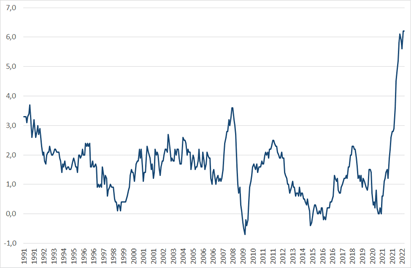
As the year draws to a close, inflation is still high and could remain so for the next few months according to the latest forecasts from INSEE and the Banque de France. While over the last 30 years (1991-2021), consumer prices have increased by an average of 1.5% per year in France, the year-on-year increase reached 6.2% in October and November 2022 (figure 1).
Figure 1. Year-on-year change in the consumer price index in France, 1991-2022, in %
Source: INSEE.
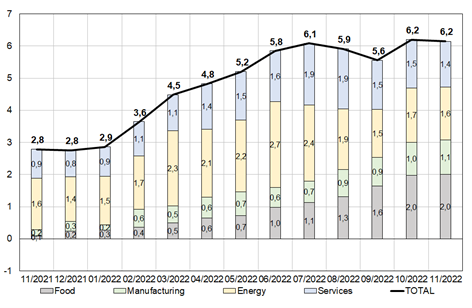
The surge in energy and commodity prices started before Russia invaded Ukraine. During 2022, their contribution in consumer price inflation has been the greatest. The rise in input costs was also passed on to manufacturing prices, particularly in food industries, and gradually in services (figure 2). As companies are each other's customers, the rise in prices for some leads to a rise in prices for others and vice versa. This is the price-price loop.
Figure 2. Contributions to year-on-year consumer price inflation in France, 2021-2022
(in percentage points)
Interpretation: in March 2022, energy contributed 2.3 points to a CPI inflation of 4.5% over one year; in November, energy contributed 1.6 points to a total of 6.2%.
Source: INSEE, calculations by DG Treasury.
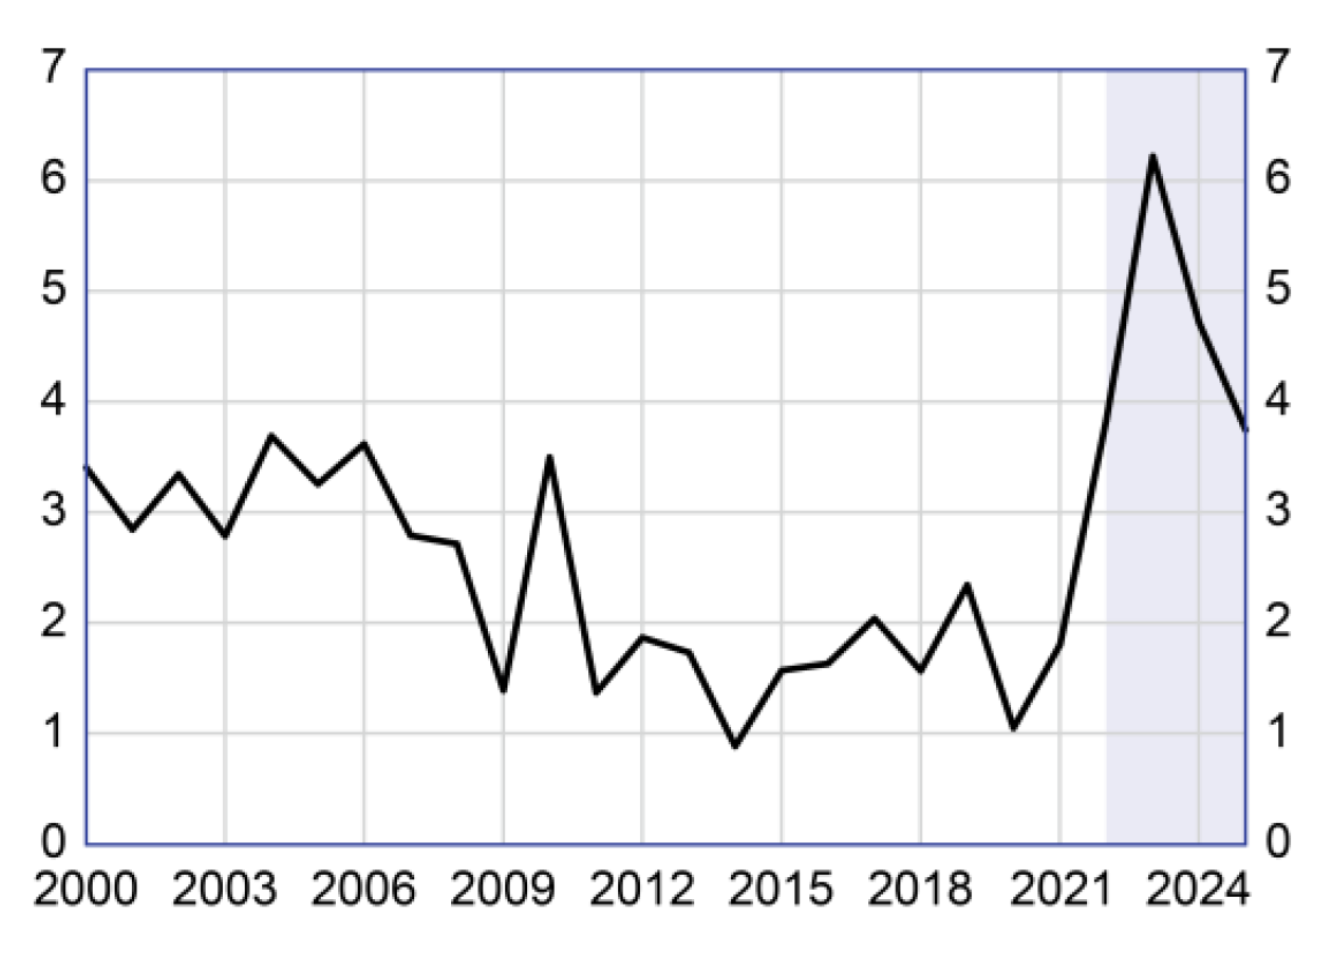
In recent months, the price of imported energy and raw materials has fallen back to a level close to that observed before the war in Ukraine (see INSEE, 16 December 2022), which should ease downstream prices. In 2023, one of the main drivers of inflation should in fact be wage growth, which could exceed 6% over one year according to the Banque de France (figure 3). This rise in wages will in turn feed the rise in prices. This is the price-wage loop.
Figure 3: Average nominal earnings per head in France, market sector, year-on-year % change
Source: Insee, and Banque de France forecasts (December 2022). The average wage is corrected for the effect of short-time work.
Some observers, considering that there is no evidence of a wage-price loop, advocate a generalised indexation of wages. They refer to a study by the International Monetary Fund according to which a period of wage catch-up does not necessarily lead to a runaway price-wage spiral. However, the IMF sample specifically excludes periods of wage indexation, with the exception of the US in the 1970s, an episode that the IMF points to as an example of a runaway. The study shows in fact that after an inflationary surge, nominal wages gradually "catch up" with prices, without the need for explicit indexation. More fundamentally, the complete absence of a wage-price loop would mean that companies would be able to absorb all the increase in their costs without passing it on in their prices, or that employees would accept to see the real value of their wages erode with inflation without any wage compensation. In reality, we are now seeing inflation spread to non-energy prices and wages. The real question is therefore not whether or not there is a price-wage loop, but how strong it is, which will determine the strength of inflation in the coming months.
Wage de-indexation
In the 1970s, general wage indexation was a powerful force in the price-wage loop: when consumer prices rose by 1%, wages automatically rose by 1%, which increased companies' costs in proportion to their wage bill, pushing up prices, etc. At the time, productivity gains had allowed wage increases to exceed inflation: thanks to productivity gains, real wages had been able to grow without the real margins of companies decreasing, as the Governor of the Banque de France, François Villeroy de Galhau, recently reminded us during a speech at the Toulouse School of Economics. Unemployment rose sharply during this period, from 3.6% in 1975 to 7.1% in 1982.
During this period, the chase between wages and prices had fuelled inflation. Between 1973 and 1982, annual inflation averaged 11.2%. It was only from 1983 onwards that inflation started to fall in France, under the combined effect of a restrictive monetary policy, a commitment not to devalue any more, a restrictive fiscal policy (la rigueur), and a ban on indexation clauses (see Mojon and Pereira da Silva, 2019).
Since then, wages are no longer automatically indexed in France, with the exception of the minimum wage (Smic), which is revalued each year on 1 January according to (1) the increase in the consumer price index excluding tobacco of the first quintile of households in terms of standard of living, and (2) half the increase in the purchasing power of the basic hourly wage of manual and clerical workers (see the Report of the Smic Expert Group, 22 November 2022). When inflation is high, as was the case this year, the minimum wage is also revalued during the year.
Increases in the minimum wage automatically lead to the revaluation of certain branch minimum wages which would otherwise be "caught up" by the minimum wage. More generally, hikes in the minimum wage increase both the probability of revaluation and the extent of revaluations of all wages during negotiations within companies, in addition to the effect of inflation itself (see in particular the recent estimate on micro data by Gautier, Roux and Suarez Castillo, 2022).
At the macro level, we do observe an increase in wages when consumer prices rise. In the Opale model, which is used by the DG Treasury to make macroeconomic forecasts, a 10% rise in the consumer price index leads, all other things being equal, to a cumulative increase in the average nominal wage per capita of 6.4% in the first year, 8% in the second year and 10% in the long term. From this point of view, the increase in the average wage per capita forecast by the Banque de France for 2022 and 2023 (respectively +3.8% and +6.2% after correction for the effect of partial activity) is consistent with inflation.
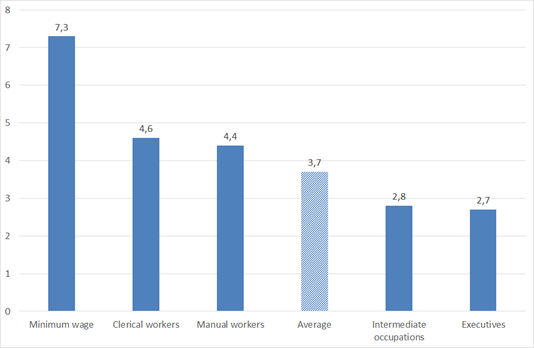
According to DARES, the basic monthly wage, which does not include bonuses, would have increased by an average of 3.7% between the third quarter of 2021 and the third quarter of 2022, with a more marked increase at the bottom of the wage scale, and therefore a narrowing of the pay scale (figure 4). We see here a major advantage of the absence of automatic wage indexation, with the exception of the minimum wage: the terms of trade shock affects workers differently depending on their position in the wage scale, with those at the lower end being protected. In addition, the absence of automatic indexation allows companies to modulate revaluations according to their exposure to the energy shock and their capacity to pass on the increase in costs to their customers. They can also spread revaluations over time, depending on the evolution of their margins. Conversely, a uniform revaluation would put some companies in difficulty in the short term.
Figure 4: Evolution of the basic monthly wage in France between 2021-Q3 and 2022-Q3, in %.
Source: Dares. Year-on-year variations in current euros.
Tariff shields
Faced with the energy shock, the strategy of the French government was to spread the effects over time via "tariff shields": a retail price control for electricity and gas to which was added the fuel discount until December 2022. The idea was to give households and businesses time to organise themselves in the face of these price increases in order to reduce their vulnerability; but also to limit the volatility of relative prices in order to reduce the negative effects on the economy. The evolution of energy prices during the year 2022 validates this approach for the moment. For example, the market price of natural gas for Europeans increased by a factor of 10 between January 2021 and August 2022, but by "only" 3 between January 2021 and October 2022 (source: Fred).
However, this policy means that the fall in energy prices is not immediately reflected in the consumer price index either, unlike in other countries, for example Spain, where inflation has fallen from its peak of 10.8% in July. The impact of tariff shields on prices in the long term will depend on how the smoothed inflation profile affects expectations and thus wage formation. It will also depend on energy efficiency efforts that may ease prices, especially for electricity, whose market is not globalised.
In a closed macroeconomic framework, Cepremap has estimated that the tariff shields are likely to have reduced inflation by about 1.1 percentage points and supported activity by about 1.75 percentage points in 2022. According to this study, general wage indexation would have led to higher inflation in 2022, with lower GDP and higher fiscal cost. The "heterogeneous agents" framework also allows for an analysis of the impact of different policies on inequality. The authors find that a generalised indexation would have done less well from this point of view than the shields, also taking into account the indexation of social transfers (which constitute nearly 70% of the income for the first decile of the standard of living), and even before accounting for the indexation of the minimum wage.
Purchasing power and the labor share
The terms of trade shock suffered by the French economy has been evaluated by the DG Treasury at 3% of GDP in 2022 compared to 2019, fosusing on the surge in imported energy prices themselves, before any pass-through or adjustment mechanism. The downward revision of growth for 2022 and 2023 since the outbreak of the war is consistent with what macroeconomic models such as Mésange predict after an exogenous deterioration in the terms of trade. The shock thus causes a reduction in value added, to be distributed among economic agents.
France differs from the other advanced countries by a stable labor share over the long term. In order to maintain a stable distribution of value added during the energy crisis, the fall in value added (compared to a non-crisis scenario) must be distributed proportionally between the two production factors: the real remuneration of labour and capital must not grow faster than GDP, the growth of which has been revised downwards.
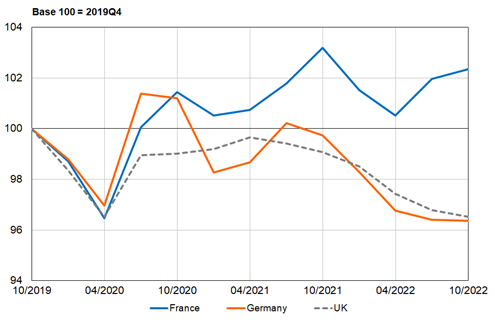
In its latest Economic Outlook, INSEE warns of a fall in margin rates in industry excluding energy, construction, transports and other market services in 2022, due to higher input prices. For its part, employment dynamics have so far compensated for the decline in average real wages. If we add to this the indexation of social benefits and the exceptional vouchers, purchasing power has been largely preserved. By the end of 2022, according to the OECD, household purchasing power would be 2% above the level at the end of 2019, while it would be 4% below its pre-Covid level in Germany and the UK (figure 5).
Figure 5: Changes in household purchasing power since Q4 2019
Source: OECD Economic Outlook (November 2022). Purchasing power is calculated as nominal disposable income adjusted for the private consumption deflator; net disposable income for Germany, gross for France and the UK.
The evolution of employment is now a major difference compared to the 1970s: in the third quarter of 2022, employment in France was 3.6% above its level in the fourth quarter of 2019, while GDP was only 1.1% above its pre-crisis level. Therefore, productivity gains have weakened, but employment has been buoyant whereas it had declined in the 1970s. While the government will have to gradually withdraw its support, employment and investment will be the key variables to alleviate the impact of this energy crisis on our economies.
***
Read more:
>> Version française : Une boucle prix-salaires sur le sapin 2022 ?
>> All posts by Agnès Bénassy-Quéré, chief economist - French Treasury
