Looking for potential growth
Following Richard and Peggy Musgrave, economists have become accustomed to grouping economic policies into three categories: those that raise the population's standard of living in the long term (structural policies), those that seek to limit its instability in the short to medium term (cyclical policies) and, finally, those that attempt to distribute the wealth produced more harmoniously than the market would spontaneously do (redistributive policies).
To differentiate between the first two categories, we use the concept of potential GDP, which can be defined as "the volume of production of goods and services that an economy can sustainably achieve by fully utilising its capacity, but without creating inflationary pressures" (Herlin and Gatier, 2017).
Like other macroeconomic concepts such as the structural unemployment rate, the neutral interest rate or the equilibrium exchange rate, potential growth has the major flaw of not being observable. It is estimated in two main ways (see Lequien and Montaut, 2014):
- Either, from a modelling of output as a function of capital, labour and productivity. In this case, assumptions must be made about capital accumulation, changes in the labour force and working hours, changes in the unemployment rate and the rate of productivity growth;
- Or, using a statistical method, by smoothing the fluctuations of GDP over a sufficiently long period, making the hypothesis that the observed GDP cannot deviate durably from the potential GDP.
The two methods can be combined. Thus, both French Treasury and the European Commission rely on a production function but insert potential employment and potential productivity, which are obtained by the smoothing method, while the potential capital stock follows the actual observed investment, corrected for capital depreciation (see Herlin and Gatier, 2017).
It should be noted straight away that, contrary to what the vocabulary might suggest, potential GDP is not an unsurpassable ceiling: GDP can exceed potential GDP when the economy is at the top of the cycle, as in 1990, 2000 or 2007 (Figure 1).
Figure 1. GDP and potential GDP of France according to the OECD, in constant 2014 € billion
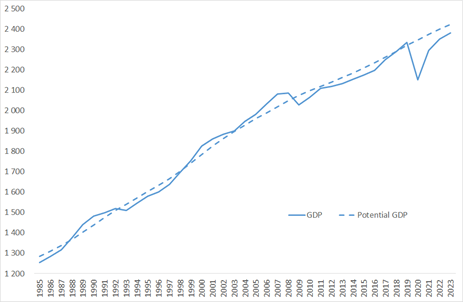
Source: OECD, Economic Outlook, June 2022.
The gap between actual and potential GDP, known as the output gap, plays a major role in setting monetary and fiscal policy:
- Monetary policy: a positive output gap in principle signals higher inflation, so that the central bank should tighten its policy; the output gap thus appears explicitly in the Taylor rule, which relates the short-term interest rate to current inflation and the output gap.
- Fiscal policy: a positive output gap means that firms cannot produce more without increasing their unit costs. The economy is therefore not in a situation of Keynesian unemployment. In this configuration, a tightening of fiscal policy has little impact on output and can help limit inflationary pressures.
Potential GDP plays an explicit role in European fiscal rules through the division of the budget balance into two components: the cyclical balance and the so-called "structural" balance, i.e. corrected for the cycle and for one-off expenditures and revenues. When actual GDP is lower than potential GDP, as is the case today in France according to the OECD (Figure 1), part of the budget deficit is due to this negative output gap: it will automatically be absorbed when GDP returns to its potential level because tax revenues will recover. On the other hand, the structural part of the deficit will not be absorbed on its own: a discretionary decision to reduce expenditure or increase taxation will be necessary to bring the balance back to equilibrium. The preventive arm of the Stability and Growth Pact thus prescribes a reduction in the structural deficit of at least 0.5 points of GDP per year when the output gap is between -1.5 and +1.5%, until a structural balance "close to equilibrium" is reached (see the Vade-mecum of the Stability Pact, 2019 edition)
Hours worked
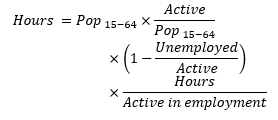
To understand potential GDP from the factors of production, the simplest way is to start with the following breakdown:
GDP = hours worked x GDP per hour worked
The number of hours worked is the product of the population of working age (15-64 years according to the international convention), the participation rate (number of active persons in relation to the population of working age), the proportion of active persons who are in employment (1 - unemployment rate) and the average duration of work (including part-time work). Analysing these different components allows us to anticipate the evolution of hours worked in the coming years.
For example, in France, over the period 2015-2019, hours worked increased by an average of 0.7% per year (Figure 2). This reflects an increase in the participation rate, the proportion of employed persons and the hours per employed person, while the population aged 15-64 started to decline. Hours worked increased at a much slower rate in the years 2010 to 2014 (less than 0.1% per year), partly because the proportion of employed persons was declining in the wake of the global financial crisis.
Figure 2. Average growth rate of hours worked in France between 2010 and 2019
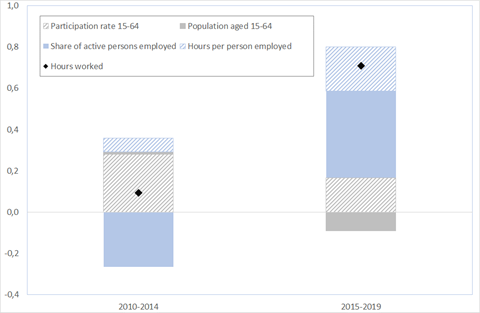
Source: INSEE. Employment survey, Eurostat. Calculations by DG Treasury.
The latest INSEE projections anticipate a quasi-stability of the active population over the period 2023-2027. However, these projections do not take into account the positive effect on the participation rate of reforms that contribute to increasing the labour supply. By way of illustration, according to the calculations of the French Treasury, an increase of two years in the age of entitlement to retirement, at a rate of 3 months per year from 2023 onwards, would increase the active population by approximately 0.9% over a 5-year period, and 1.4% until completion of the reform.
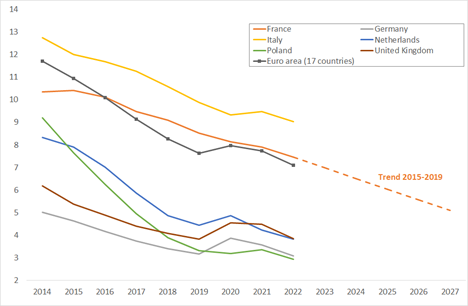
The continuation of the decline in the unemployment rate observed since 2015 will depend on employment policies, but also on the evolution of productivity (see below) and, of course, on the macroeconomic situation. A continuation of the trend observed over the period 2015-19 would be consistent with developments elsewhere in Europe, a convergence towards lower levels of unemployment is now being discernible (Figure 3). All other things being equal, a fall in the structural unemployment rate of 2 percentage points over 5 years, or 0.4 pp per year, would roughly translate into a 0.4 pp increase in the growth rate of hours worked over this period.
Figure 3: Unemployment rates in different European countries, 2014-2022
As a % of the labour force
Source: OECD.
Productivity
The downward trend in the unemployment rate is mechanically accompanied by a slowdown in productivity per worker, as people who find a job have, temporarily or not, a slightly lower productivity than the average of those already in employment. According to the Dares Acemo-Covid survey, the main measure taken by companies to overcome recruitment difficulties would be to change the profile of the people recruited, particularly in terms of skills. The skill mismatch could become more pronounced as unemployment falls. Hiring difficulties, which are particularly high in 2022, may also lead companies to retain labour even in periods of under-activity.
The path of the unemployment rate over the period 2022-2027 is naturally very uncertain. However, it should be remembered here that GDP is the product of hours worked and productivity per hour (see above). To the extent that lower unemployment is at least temporarily accompanied by less dynamic productivity, an error in the evolution of unemployment would only partially affect potential growth (Figure 4).
Figure 4: The potential GDP factory
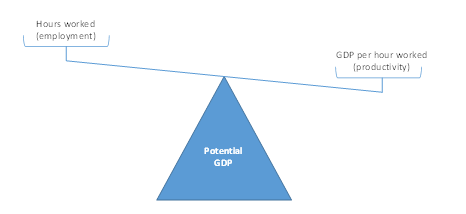
The potential growth assumption underlying the Economic, Social and Financial Report annexed to the 2023 Budget is 1.35% per year, of which about one-third is the result of growth in hours worked and the remaining two-thirds of productivity growth. The 2018-2022 Public Finance Programming Act already assumed potential growth of 1.35% in 2022, albeit with a smaller contribution from labour and a larger one from productivity (Table 1). In the meantime, employment has been more dynamic than expected, suggesting a growth that is richer in jobs (but conversely poorer in productivity) than in the past.
Table 1. Potential growth scenario of the French government
|
% per year |
2022 (pre-Covid estimate) a |
2023-2027 (October 2022 estimate) b |
Révision b-a |
|
Potential growth |
1.35 |
1.35 |
0 |
|
Contributions: |
|
|
|
|
Hours worked |
0.2 à 0.3 |
0.4 à 0.5 |
+0.2 |
|
Labour productivity |
1.1 à 1.2 |
0.9 à 1.0 |
-0.2 |
|
Of which: capital deepening |
0.5 |
0.5 |
0 |
|
total factor productivity |
0.6 à 0.7 |
0.4 à 0.5 |
-0.2 |
Sources : RESF 2022 and 2023.
The evolution of labour productivity is itself decomposed into two contributions:
- Capital accumulation per worker
- Growth in total factor productivity (TFP), also known as the combined efficiency of labour and capital.
While capital accumulation per worker has not weakened in recent decades, TFP has decelerated in advanced economies, France being no exception (Bergeaud, Cette and Lecat, 2020; Conseil national de productivité, 2019).
Long Covid for potential growth?
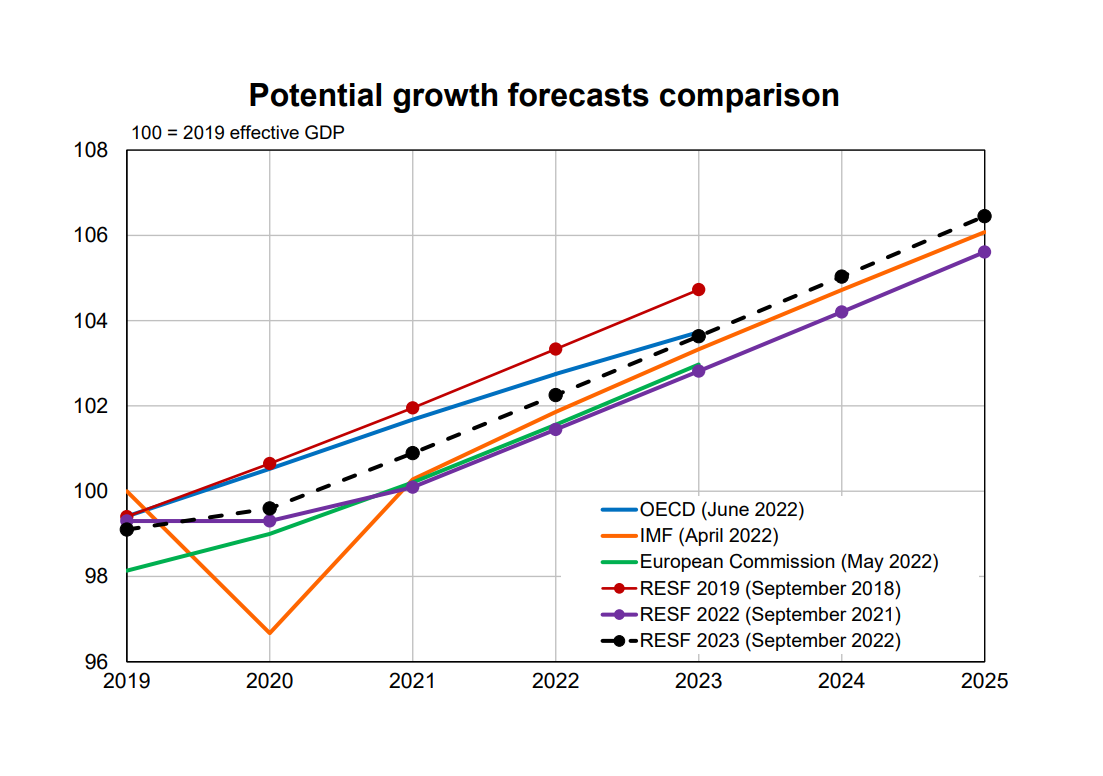
During the Covid crisis, most forecasters revised downwards their estimates of the level or growth rate of potential GDP, due to the temporary decline in investment (and thus, capital accumulation), but also to the experience of past crises that were almost always followed by a slowdown in TFP (see Herlin and Gatier, 2017). In the RESF 2021 multi-annual scenario (published in October 2020), a permanent loss in potential GDP of just over 2 percentage points was assumed. The very good performance of productive investment and employment, the resilience of the productive fabric, the absence of a proven zombification of the economy and, finally, the acceleration of the digitalisation of the economy (including the spread of teleworking) then led the Government, like other forecasters (Banque de France, OFCE in particular), to revise downwards the loss of potential GDP linked to the pandemic: it was estimated at -1 ¾ points in the RESF 2022, then at -¾ point in the RESF 2023 (Figure 5).
It must be said that unlike several past crises, notably the 2008 crisis, the Covid crisis was perfectly exogenous to the economy: as long as the production factors – capital and labour – had been preserved, a return to the growth path close to that of the pre-crisis period was now possible. As early as 2021, Fernald and Li (2021) predicted that the health crisis would not have a lasting impact on potential growth in the United States, and they went even further by judging that there would be no impact either.
Figure 5 : different estimates of potential GDP for France
Sources: INSEE, OECD, IMF, European Commission, RESF 2019 to 2022, DG Treasury calculations.
The estimate of potential growth varies according to the experts. Using a method similar to that of the government, the Independent Fiscal Council estimates it at 1.05% per year, due to a more conservative hypothesis on the effects of future reforms on the labour market and on productivity gains. For its part, the European Commission obtains a figure similar to that of the Government for the period 2022-2023, and lower thereafter (but without taking into account future labour market and pension reforms). The Government's estimate is comparable to that of the IMF in its April 2022 publication, or to that of the OFCE in its July forecast (see Table 2).
Table 2. Different estimates of potential growth post pandemic for France
(% per year, average 2022-2027)
|
|
Date |
% per year |
|
Government |
October 2022 |
1.35 |
|
OFCE |
July 2022 |
1.3 |
|
Independent fiscal council |
July 2022 |
1.05 |
|
European Commission* |
May 2022 |
1.1 |
|
International Monetary Fund |
April 2022 |
1.38 |
* 2022-2026. Source: French Treasury calculations.
What will be the impact of the energy crisis on potential growth? In the presence of a deterioration in the terms of trade, consumption is expected to be reduced but not necessarily production: higher import prices force people to produce more to maintain the same level of consumption, or to consume less for the same level of production (Kehoe and Ruhl, 2008).
However, the energy crisis is not just a terms of trade shock. Russia's invasion of Ukraine, but also concerns about Taiwan, could lead to a reorganisation of international value chains to limit supply risks. The counterpart would be higher costs, but also temporarily higher investments, with an uncertain net effect. Similarly, the ecological transition will have an uncertain effect on potential GDP, even if in the long term it will allow us to benefit from cheaper energy.
***
Read more:
>> Version française : Chacun cherche sa croissance potentielle
>> All posts by Agnès Bénassy-Quéré, chief economist - French Treasury

