Firm-level data throughout the Covid crisis in France
Over the last decade, a rising amount of French firm-level data has been made available to researchers. Anonymized financial statements and tax records can be recovered through a Secure data hub, upon authorization granted by the Statistical confidentiality committee. Throughout the crisis, the French Ministry for the Economy, Finance and Recovery has used available data intensively as soon as they were made available. Three successive stages may be distinguished.
Stage 1 (March-August 2020): ex-ante analysis
At the beginning of the Covid crisis, in March 2020, the need to protect the corporate sector from the damage of the lockdown emerged very quickly. That said, the design and calibration of such support was not straightforward. At that time, only financial statements for 2017 were available in a consistent format. In order to quantify financial needs, microsimulations were run by the Treasury. Specifically, monthly sector-level shocks provided by Insee (17 sectors) for 2020 were applied to firm-level turnover for 2017 (recovered from financial statements). Fixed costs were assumed to be… fixed, and some assumptions were made on firms’ ability to adjust their variable costs over time. Then, depending on the eligibility criteria and calibration of the support schemes (mainly short-time work and subsidies through the solidarity fund), firm-level cash-flows were simulated on a monthly basis. Assuming no credit constraint (thanks to the quasi-automatic distribution of state-guaranteed loans by the banking sector), a firm with negative cash-flow would accumulate debts, on top of existing debts measured at end-2017. When debts would exceed total assets, the firm would be deemed insolvent.
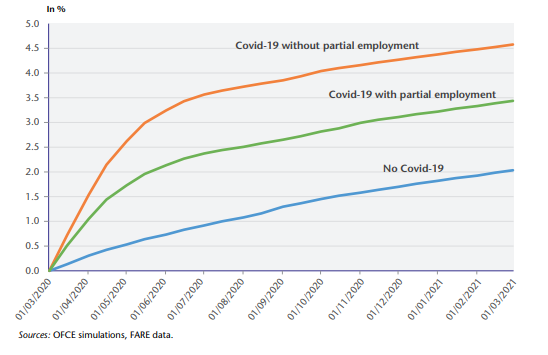
Other institutions ran similar types of microsimulations, sometimes using the international but non-exhaustive database Orbis which we do not consider here. In July 2020, Guerini et al. (2020) were the first to publish a cumulated share of newly insolvent firms due to the crisis (Figure 1).
Figure 1. Cumulated share of newly insolvent firms, Mar 2020-Mar 2021
(% of initially solvent firms)
Note: simulations based on end-2017 financial statements and on a fall in activity by an average -32% during 2.5 months compared to pre-crisis, followed by gradual normalization up to -5% in September 2020 and -2% at end-2020. The solidarity fund is not accounted for.
Source: Guerini et al. (2020).
Stage 2 (Sep. 2020-June 2021): real-time data
There were two major problems with the first vintage of microsimulations. First, they were relying on sector-level activity shocks, while it soon became clear that intra-industry and geographic heterogeneity were major features of the crisis (see Barrot, 2021). Second, assumptions had to be made about the adjustment of payrolls and about the take-ups of support schemes.
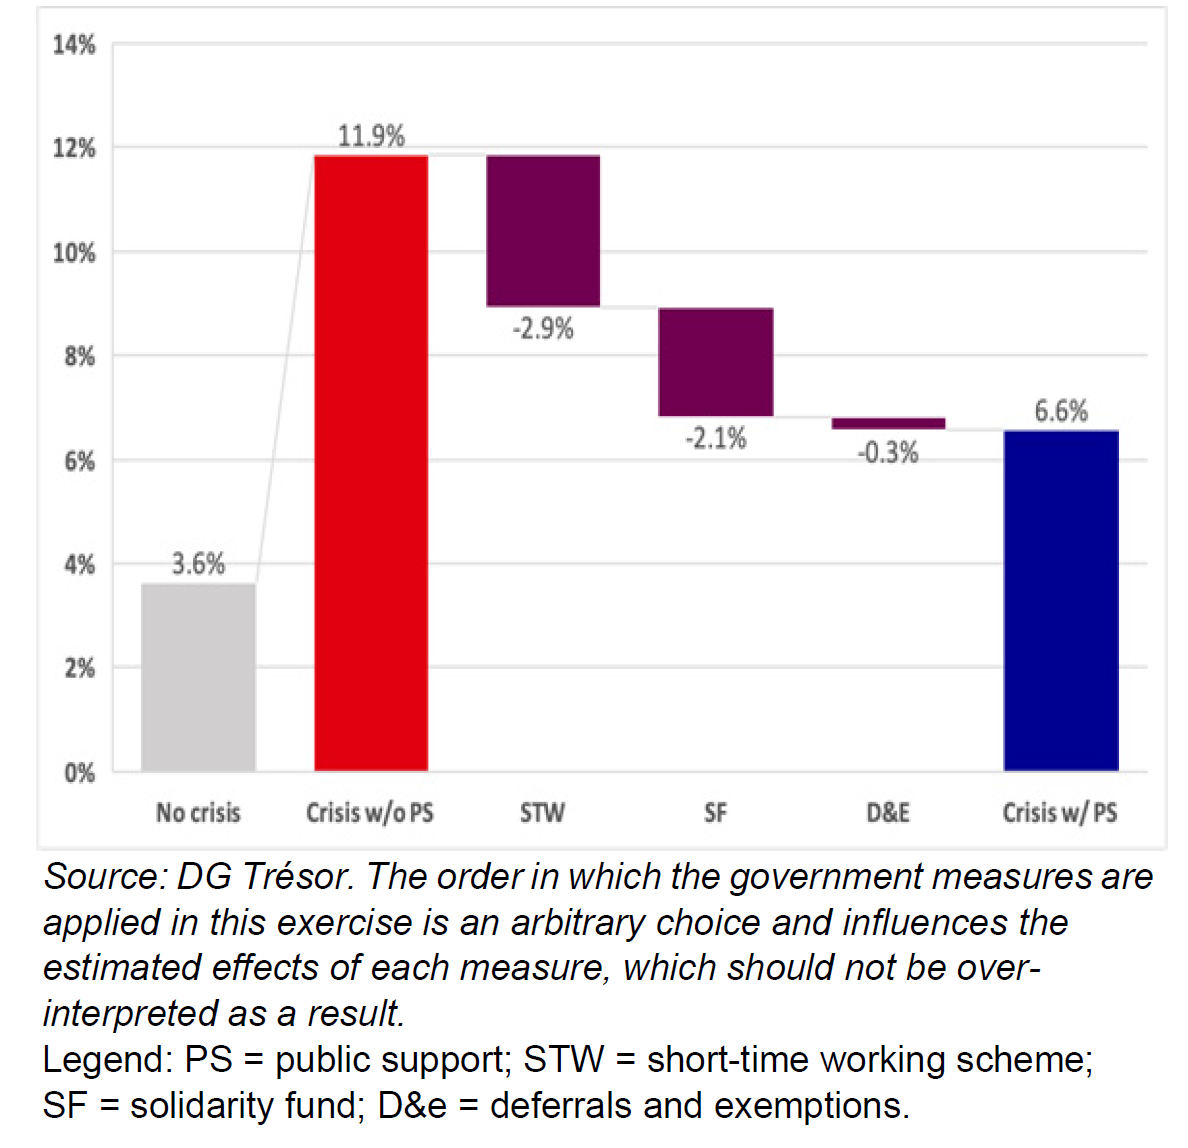
Starting in September 2020, these two pitfalls could be fixed by using almost real-time data: (i) individual VAT (value-added tax) returns, providing proxies for firm-level activity shocks (except for very small firms), and (ii) administrative records of firm-level payrolls and take-ups of support schemes. Subsequently, a second wave of microsimulations was performed by Hadjibeyli, Roulleau and Bauer (2021a) at the Treasury, based on end-2018 financial statements that had become available in the meantime. The results are summarized in Figure 2: without a crisis, around 3.6% of initially solvent firms would have turned insolvent between March and December 2020. The Covid crisis would raise this proportion to 11.9% before government support. Short-time work would reduce it by 2.9 percentage points, the solidarity fund by an additional 2.1 pp, and tax deferrals and exemptions by 0.3 pp. Accounting for the three support schemes, the proportion of newly insolvent firms would be “only” 6.6% by Dec. 2020 (note that insolvent firms do not necessarily default).
Figure 2. Cumulated shares of insolvent firms over Mar-Dec 2020
(in % of initially solvent firms)
Source: Hadjibeyli, Roulleau and Bauer (2021a).
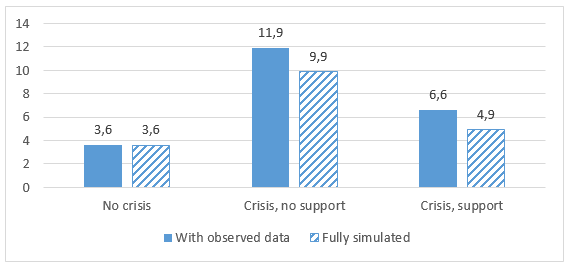
Similar research was carried out by Banque de France and Insee, with additional assumptions concerning intercompany credit, fixed capital investment and the distribution of dividends, but with less detail on government support (see Bureau et al., 2021). Hadjibeyli, Roulleau and Bauer (2021b) have compared the results from a method based on observed payrolls and support take-ups, to those obtained without this information, hence “fully simulated” results. As evidenced in Figure 3, applying industry-level shocks to all firms of a given sector amounts to underestimating the severity of the shock for some firms, and thus the overall share of insolvent firms.
Figure 3. Cumulated shares of insolvent firms over Mar-Dec 2020
(in % of initially solvent firms: impact of better accounting for firm heterogeneity)
“Fully simulated” means that shocks are sector-level shocks and take-ups are simulated.
Source: adapted from Hadjibeyli, Roulleau and Bauer (2021b).
The Committee on the Monitoring and Evaluation of Financial Support Measures for Companies Confronted with the Covid-19 Epidemic has also made use of firm-level data, e.g. showing that government support had benefited relatively more to smaller firms with intermediate profitability (see Coeuré, 2021). These firms are more likely to have avoided insolvency thanks to government support.
Stage 3 (since July 2021): financial statements and corporate defaults for 2020
These microsimulations based on observed data on payrolls and take-ups were still unsatisfactory. In particular, they were still using end-2018 financial statements. Due to the transition of a tax credit to a tax cut, French firms received an extra transfer worth 1.4% of their value added on aggregate in 2019. This double count came on top of robust GDP growth that year (+1.8%). Furthermore, monthly VAT returns are a noisy source of information. For instance, data for August and September are disturbed by accountant vacations; and very small firms only report quarterly or even yearly.
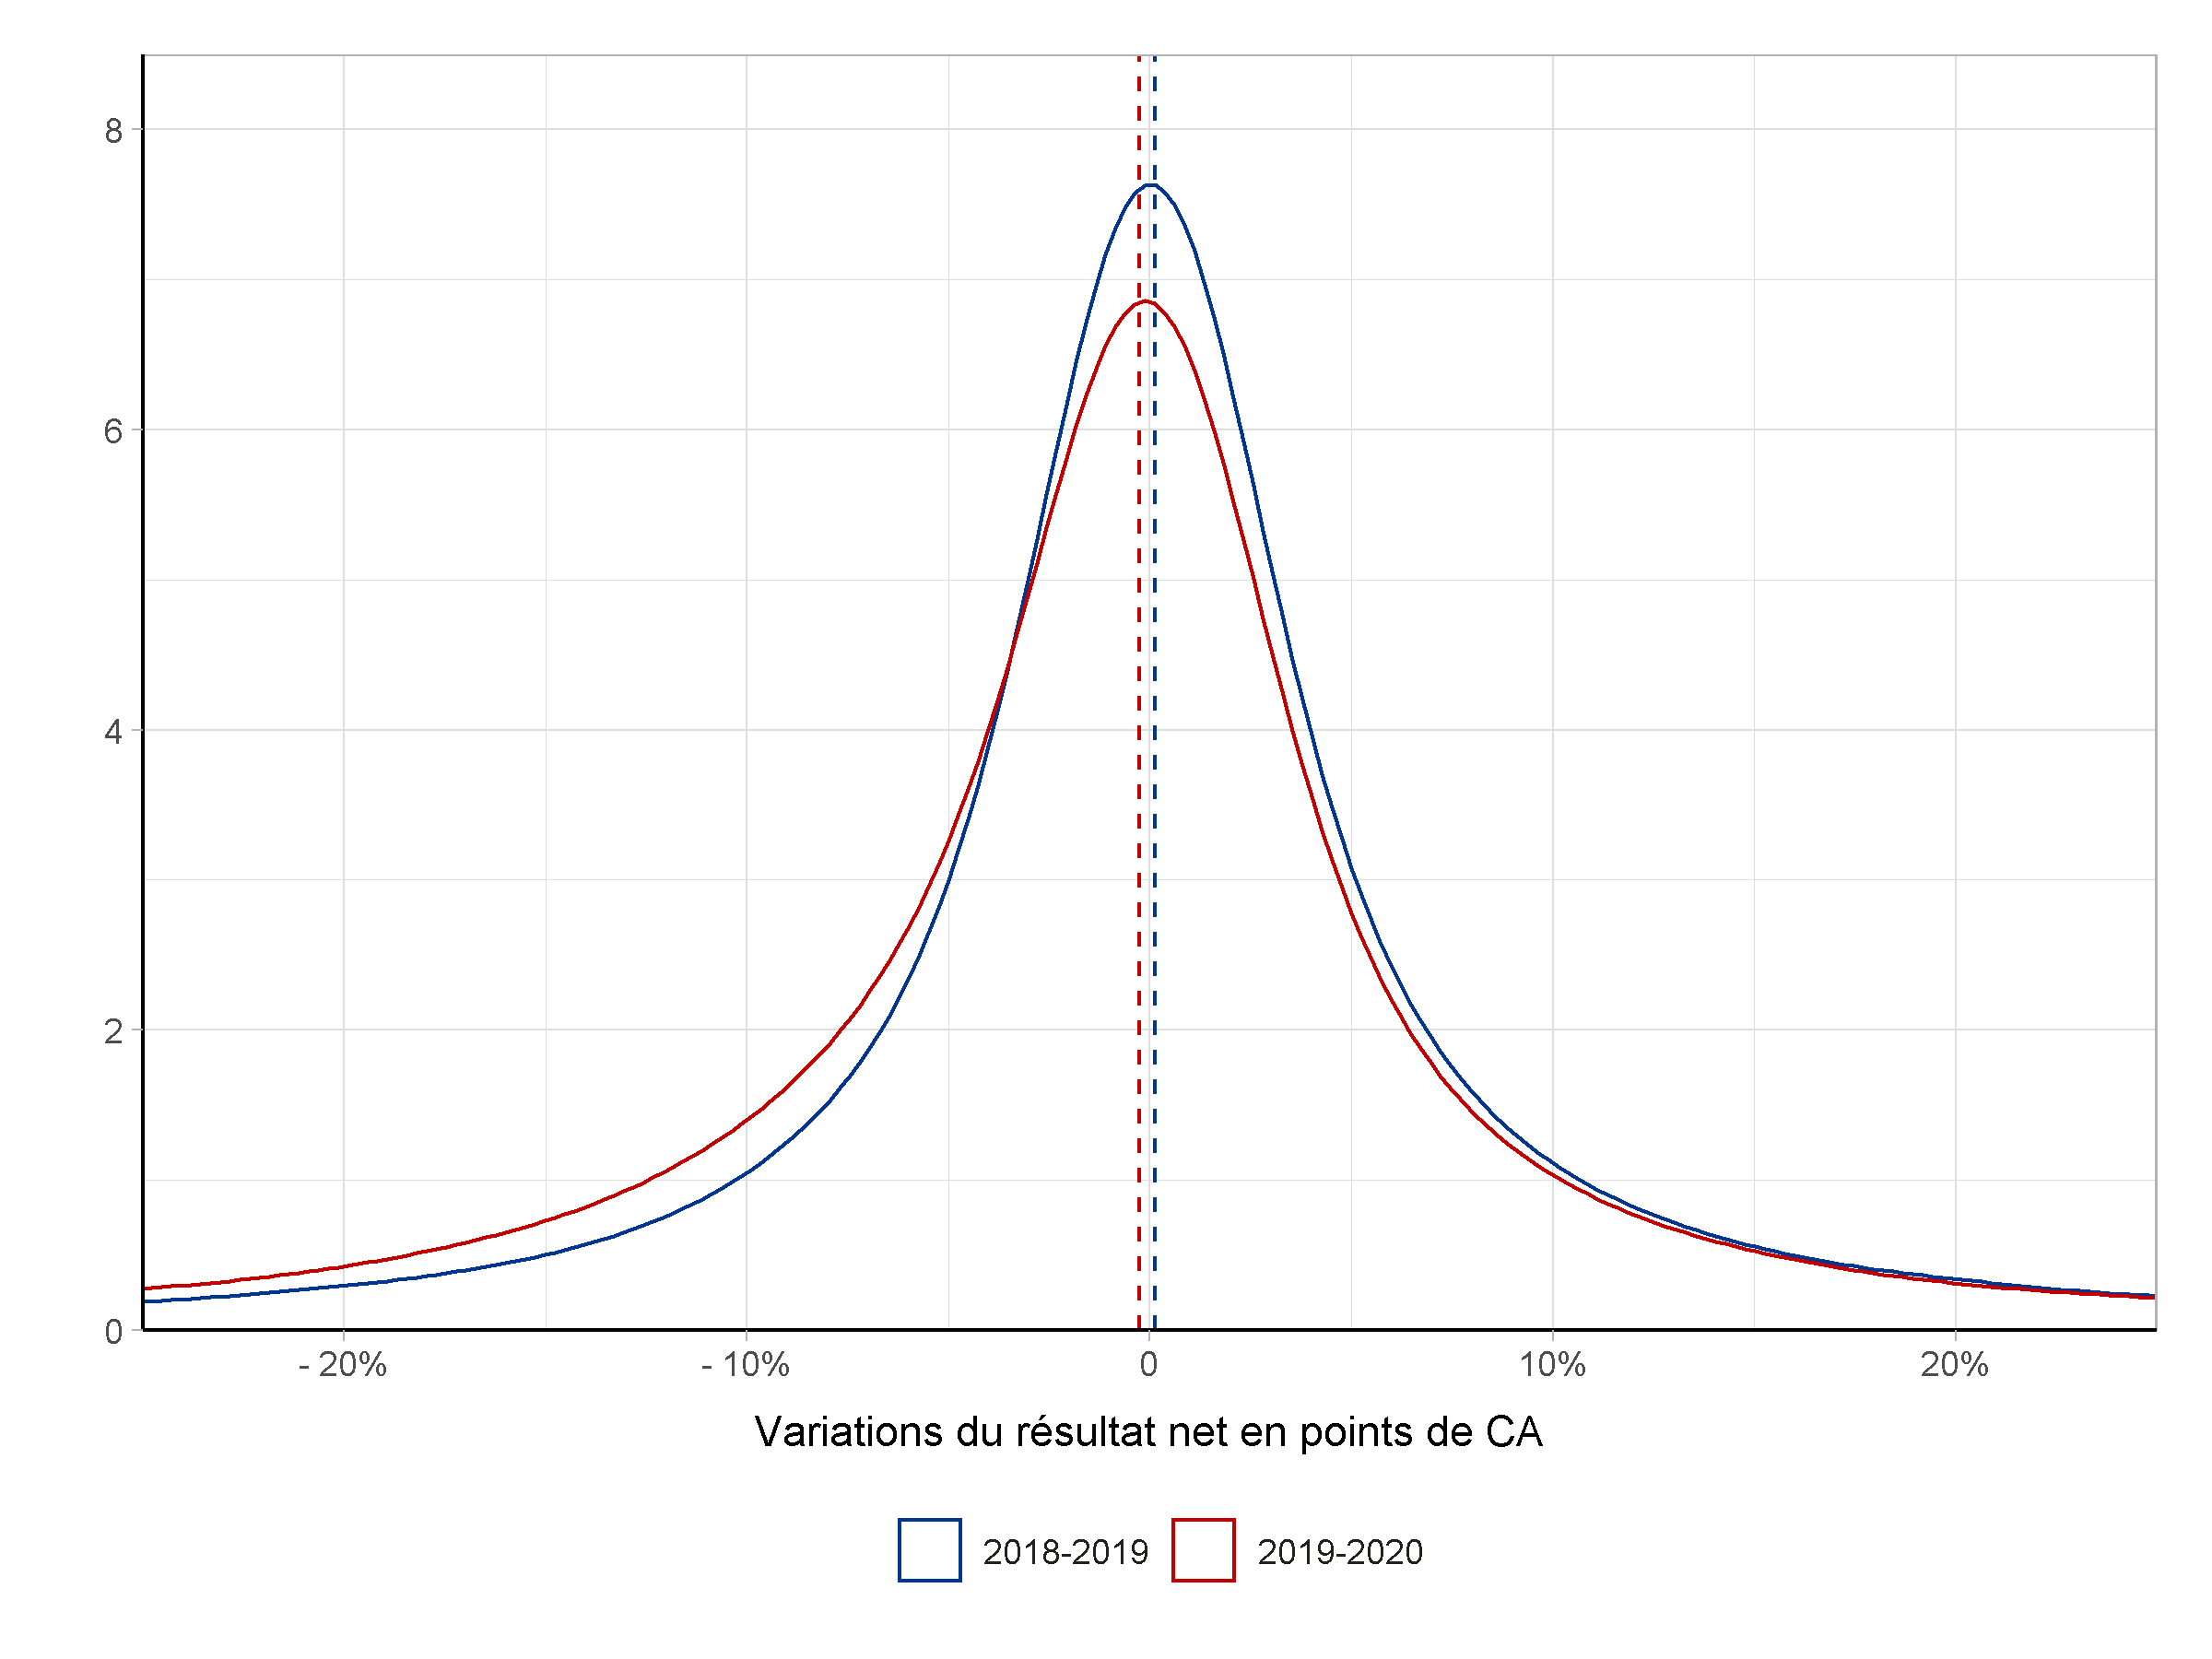
In May 2021, a subsample of 205,392 balance sheets for year 2020 (firms with annual turnover of at least 750 k€) were analyzed by the Banque de France, showing that only 14% of them had experienced both a rise in gross financial debt and a decrease in their cash position. In the fall of 2021, the French Treasury found a close proportion of 13% for a larger sample of 707,000 non-farm, non-financial firms subject to the “normal” tax regime and for which statements were also available in 2018 and 2019, representing 75% of turnover in France. It was found that, between 2019 and 2020, the median turnover variation was -5.7% while the median change in operating expenses amounted to -4.6 percent of pre-crisis turnover. Thanks to government support, though, the median financial result was reduced by only 0.3 percent of pre-crisis turnover between 2019 and 2020. However, compared to a year before, the distribution of profit variations was skewed to the left, meaning that a higher share of firms suffered from a drop in their profit rate in 2020 (Figure 4).
Figure 4. Annual variation in financial results
(in % of turnover)
Source: French Treasury (preliminary).
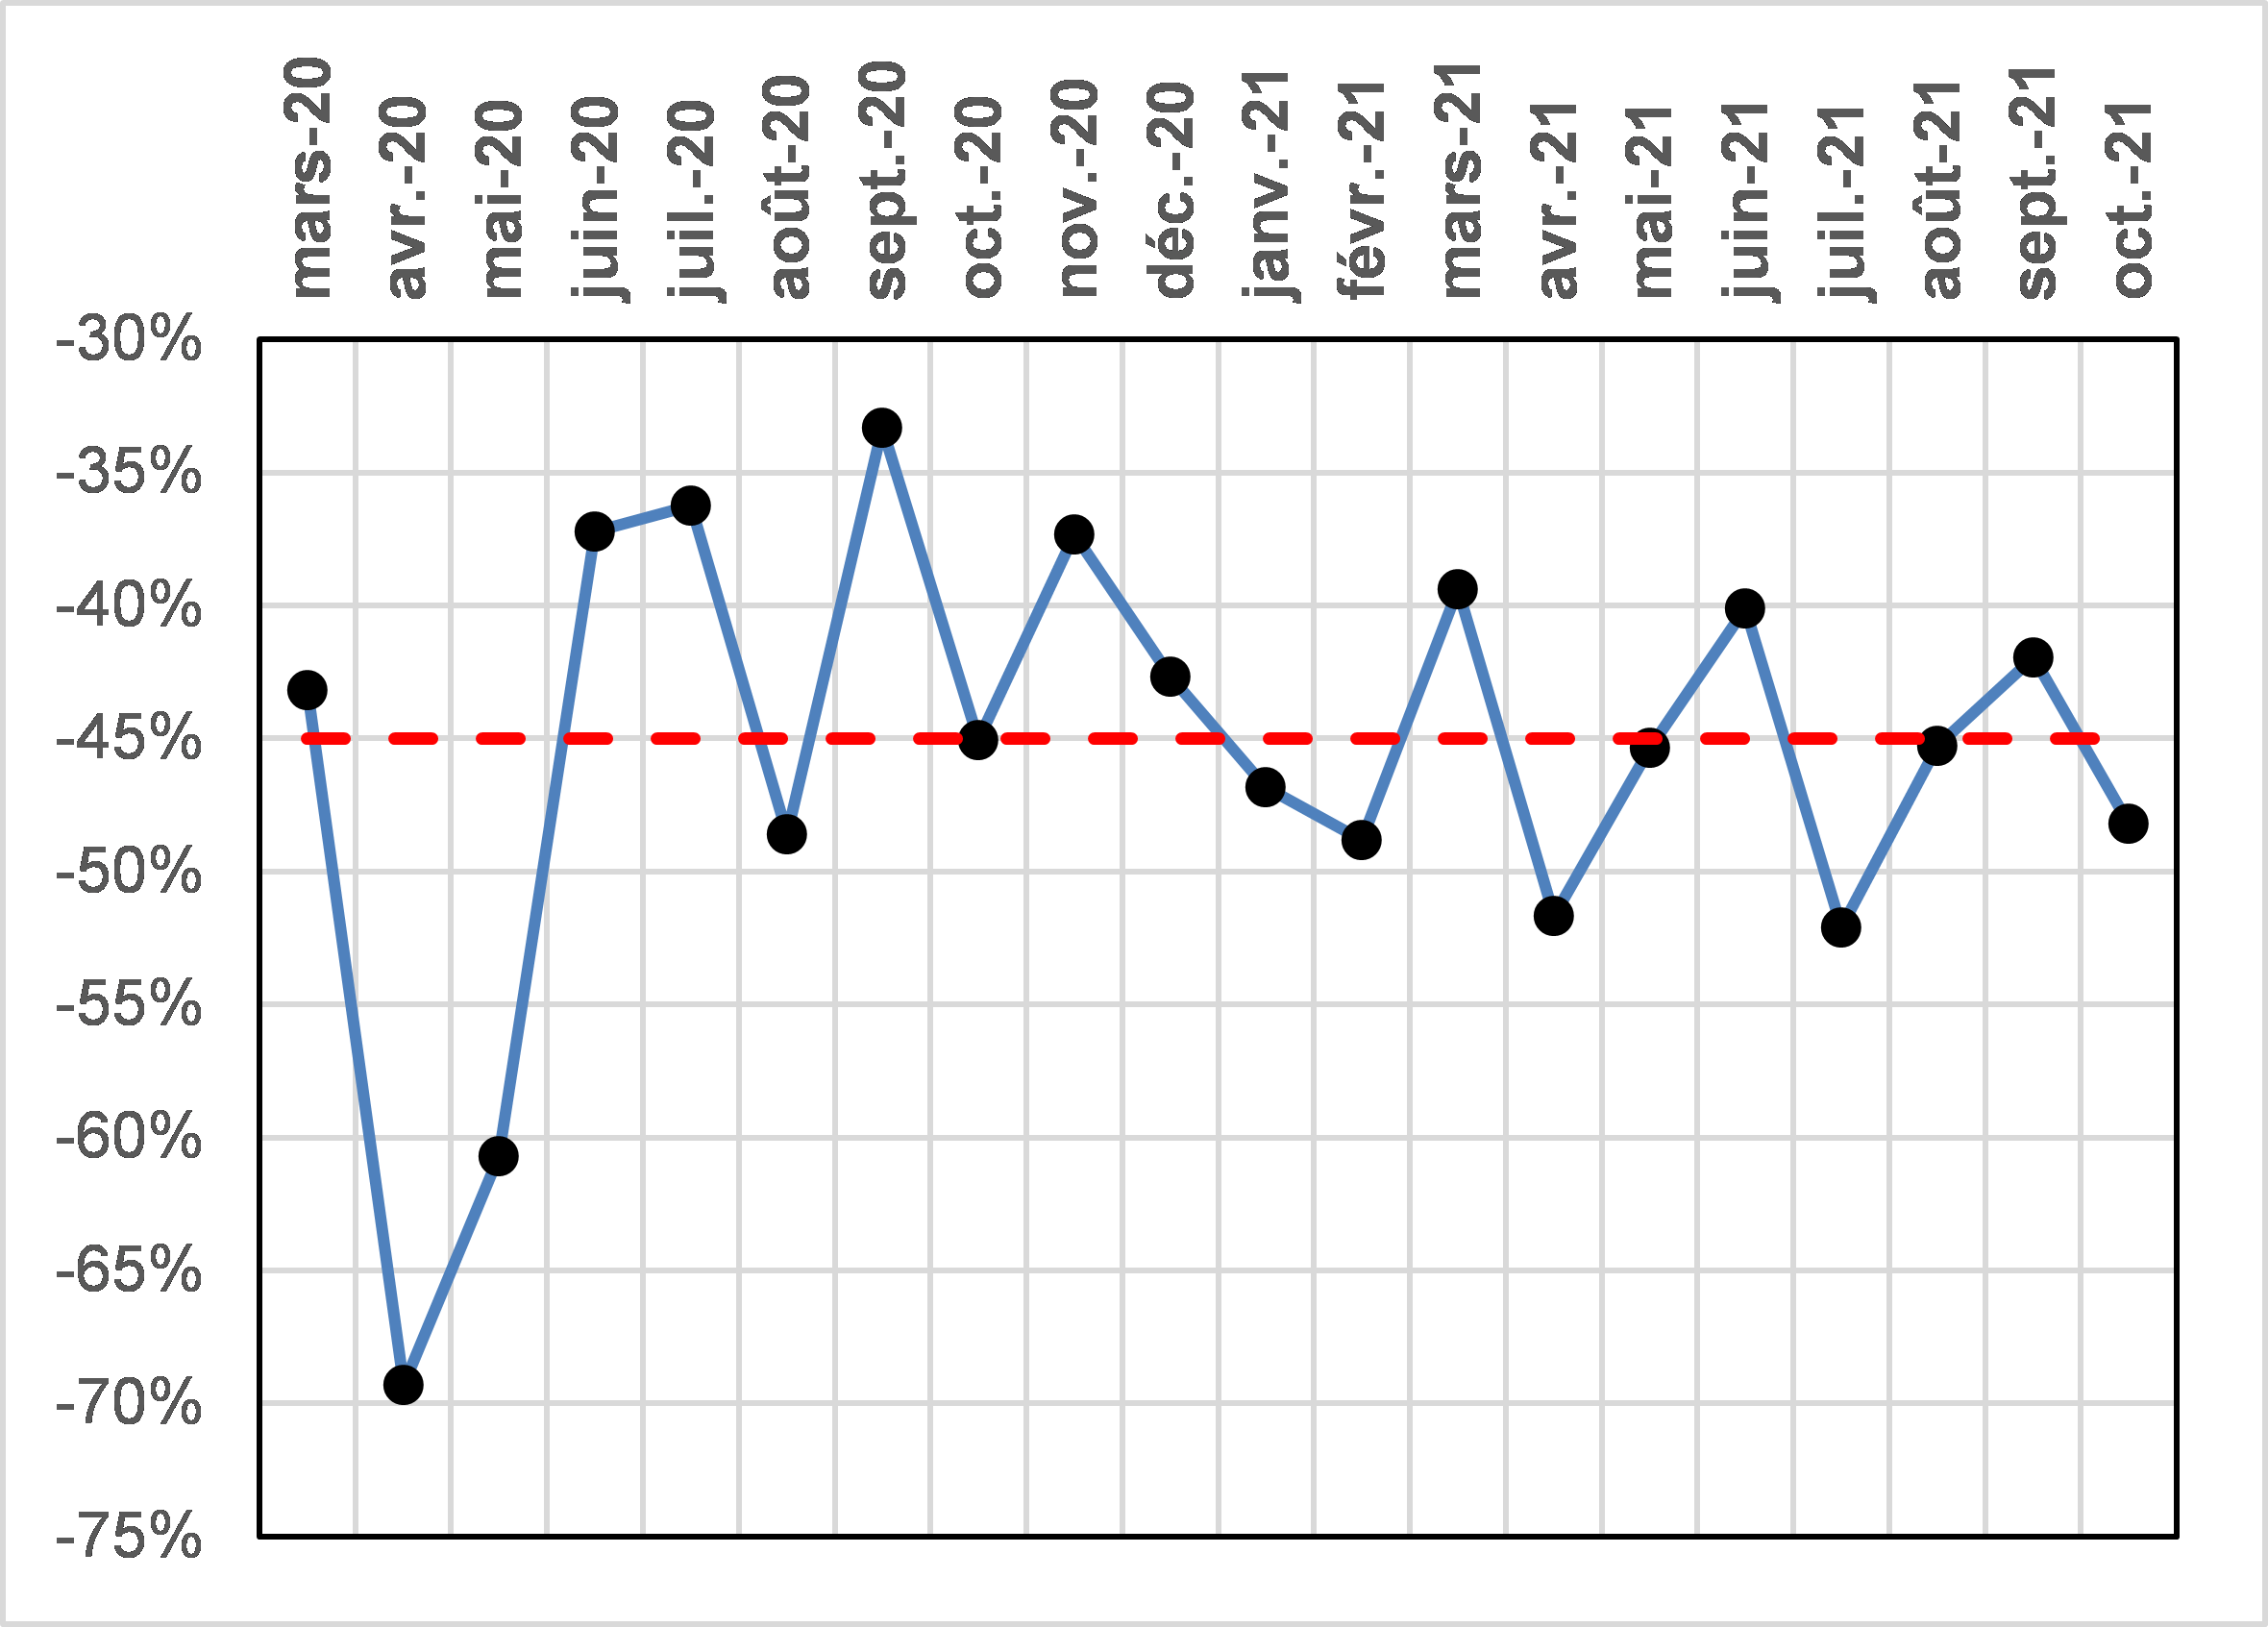
A complementary source of information on corporate health came from the number of business failures according to the records of commercial courts, which evidenced a sharp reduction in business failures in both 2020 and 2021, compared to 2019 (see Figure 5). Boekwa Bonkosi, Épaulard, and Gache (2021) have noticed that this decrease has been smaller for larger firms, leading to a more limited drop in the number of jobs in defaulting firms. They have also emphasised that the drop in defaults is roughly the same for those sectors most affected by the crisis as for other sectors, suggesting that public support has been instrumental in limiting defaults.
Figure 5. Monthly number of defaults relative to same month in 2018 and 2019 (average)
Reading: in March 2020, the number of defaults was 43% less than the average in March 2018 and March 2019. Defaults cover judicial settlements and liquidations. Dotted line represents the average over March 2020-October 2021.
Source: Maadini and Hadjibeyli (forthcoming) based on Bodacc.
At the end of 2020, Cros, Épaulard and Martin (2020) matched the data on defaults with pre-crisis financial statements in order to investigate a possible zombification of the economy. They found that the factors explaining defaults in 2020 were the same as usual, concluding to a “hibernation” rather than a zombification. Maadini and Hadjibeyli (forthcoming) further found that defaulting firms in 2020 displayed more deteriorated characteristics, notably lower productivity, than those defaulting in 2019, and that this deterioration was larger than for other firms, meaning that the cleansing effect was still at play, although with fewer defaults. However, their econometric exercise shows that the impact of financial characteristics was mitigated during the crisis, probably due to the interference of other sources of heterogeneity.
The prognosis of non-zombification made in 2021 was consistent with two other studies:
- The Committee on the Monitoring and Evaluation of Financial Support Measures for Companies Confronted with the Covid-19 Epidemic (2021) found that “zombie firms” did not receive more support than their share of the economy;
- Bach et al. (2021) found that state-guaranteed loans were not much extended to low-profit firms, and that net debt had not much increased for firms benefiting from these loans.
Finally, the impact of the crisis on the corporate sector was also apprehended through their bank accounts. Épaulard et al. (2021) have screened the (anonymized) bank accounts of around 100,000 small and very small firms up to August 2021. The proportion of firms with low net position was found stable in August 2021 relative to December 2019, although with varying situations depending on sector and location.
***
The Covid crisis offers an extraordinary experience for research in economics. The wealth of firm-level data will surely help to draw lessons that exceed this crisis and push the frontier of knowledge forward. After analyzing the phasing-out of government support, time will come for ex-post evaluation: has government support to corporations achieved its objectives? Was it cost-efficient? This last stage will be carried out by independent researchers. A lot of interesting work upcoming for the profession in the years to come!
***
Read more:
>> Version française : Les données d’entreprises durant la crise Covid en France
>> All posts by Agnès Bénassy-Quéré, chief economist - French Treasury

