Article
Energy crisis: Europe by candlelight?

The International Monetary Fund has revised downwards its forecast for world growth for 2022 (-0.8 percentage points) and for 2023 (-0.2 pp). Unsurprisingly, Europe is heavily affected by Russia's invasion of Ukraine and its geopolitical consequences, to varying degrees depending on the energy mix, exposure to Russia and the share of industry in each country's economy (Figure 1).
Figure 1. Revised IMF growth forecasts for 2022 and 2023
(deviation from the January 2022 forecast, percentage points)
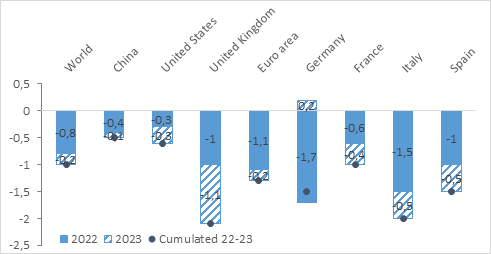
Source: IMF, World Economic Outlook, April 2022.
Of course, the revision of the growth outlook is not only due to the war in Ukraine. The current epidemic wave in China is also clouding the forecast. However, the war is a major factor in this revision, taking into account the situation as of 31 March 2022, with oil prices of nearly US$107 per barrel in 2022 and US$93 in 2023 (compared to an average of US$91 at the beginning of the year).
Numerous figures on the impact of the war on the European economy have been produced over the past two months, sometimes with different orders of magnitude. How can we make sense of them? We can proceed in two steps: (1) which shocks? (2) which transmission channels to the European economies?
Which shocks?
Although it only represents 1.75% of world GDP (2020 figure in current dollars, source: World Bank), Russia is a major world player in the production and export of hydrocarbons, but also of fertilisers, metals, cereals and wood. The war is severely affecting these supplies.
For European economies heavily dependent on Russian hydrocarbons, the energy shock will probably be the most painful. To calibrate it, the question of oil (world market) and gas (local market) must be treated separately.
Crude oil
Even before the war began, crude oil prices rose sharply as a result of the economic recovery from the Covid crisis, while supply had not fully returned to its pre-crisis level (Graph 2). The war has reinforced this movement, as Russian supply has decreased due to transport and payment difficulties in connection with the sanctions. According to the International Energy Agency, deliveries may have already fallen by around 2.5 million barrel-days (or 3% of global supply). In the event of a European embargo on Russian crude oil, 3.4 million barrel-days would disappear from the market, i.e. 4% of world supply, if we disregard re-directions to other countries, which would probably be limited despite the discount they enjoy.
Figure 2. Daily crude oil price (Brent, current US$ per barrel)
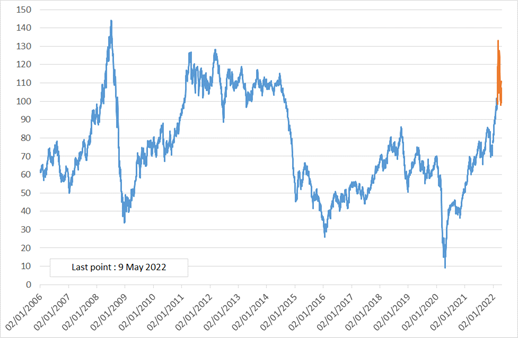
Source: Fred, Federal Bank of St Louis. The period of war is in red.
Between the period January-February 2022 (up to and including 23 February) and the period 24 February-25 April, the price of crude oil increased by 22% (from $91 to $111 per barrel). A strong price response (+22%) to a moderate decline in expected global supply (-3%) means that global demand and non-Russian supply are not very price sensitive (or elastic): the price has to rise a lot to convince oil producers to increase their supply and to discourage some demand, and thus clear the market.
The sum of their elasticities is here implicitly equal to 3%/22% = 0.14 over the period. By applying these same elasticities to a decline in world supply of 4% rather than 3%, the price increase would be 4%/0.14 = +29% compared to the pre-war level, which would put the price of a barrel at 117 dollars.
Using short-term elasticities more in line with the academic literature (of the order of 0.1 for both supply and demand, cf. Labandeira et al., 2017, Caldara et al. 2019), the price increase would be 4%/(0.1 + 0.1)=+20%, which would put the price of a barrel at 109 dollars. Conversely, the demand subsidy implemented in many countries could weaken price elasticities. In the end, if the price elasticity of demand were zero, i.e. if demand were totally rigid whatever the price before subsidies, the same simple model would lead to a price increase of 4%/0.1=+40% compared to before the war, and thus to a barrel of 127 dollars.
Some experts instead estimate the additional production margins in the rest of the world, and then ask how much the oil price must rise to bring demand down to the level of supply. From an economic rationality point of view, this approach is equivalent, as prices have to rise to convince suppliers to extract more oil. However, this alternative approach better takes into account the fact that oil supply is actually held by a cartel - OPEC - which has so far shown no sign of deviating from its initial production trajectory, despite rising prices and unused margins. This is a bullish factor for prices.
Conversely, a bearish factor is often overlooked: the decline in global activity. Assuming that world GDP is reduced by around 1% (IMF figure, see graph 1), world demand for crude oil could be lower by around 1%, reducing the shortage and therefore the price increase. This effect is included in the macroeconomic models simulating the impact of the war on the world economy, but not in those that consider a country in isolation, the price of oil being an assumption outside the model.
As can be seen, there is therefore a great deal of uncertainty about the evolution of the price of crude oil, but this is nothing compared to gas.
Natural gas
The case of gas differs from that of oil because European imports are mainly delivered via gas pipelines: due to transport constraints, the gas market is not global but rather regional, and prices are not unified (graph 3). Gas prices have risen sharply in Europe in 2021, as the sharp increase in demand linked to the economic rebound has been met with less dynamic supply from the Netherlands and Russia, the latter having gradually stopped serving short-term markets (honouring only its already signed long-term contracts).
Figure 3. Monthly natural gas prices, in US dollars per mmbtu*.
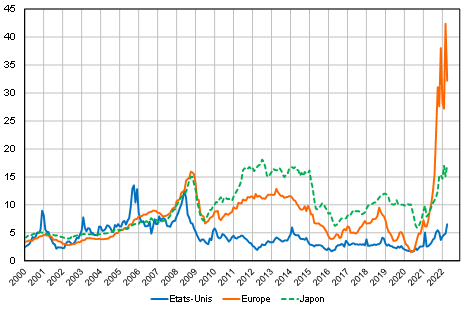
Sources: World Bank and IEA. * Million Metric British Thermal Unit: 20 mmbtu are equivalent
to about 6 MWh. Last point : April 2022.
In 2020, Russia produced 22% of the world's gas while Europe consumed 13% of the natural gas produced in the world (Enerdata figures). As Russia accounts for around 40% of the gas consumed in Europe, the disappearance of this supply would represent a shock of 13%x40%=5% at world level but much more at regional level, as alternative supply is limited by the transport and re-gasification capacities of imported liquefied gas (LNG), which today accounts for only 20% of European supply (source Bruegel). Replacing Russian gas imports entirely with LNG would mean tripling European LNG supplies, which in the short term is neither technically possible (limited supply on the world market, low additional regasification capacity in Europe) nor economically feasible (Europe is in competition with Asia on the LNG market, and redirecting flows to Europe is costly). In this respect, the IEA envisages a substitution of only 13% of the missing Russian gas.
This is why, since 2021, the price of gas has risen much more than the price of oil for Europeans: around +60% in March 2022 compared to February; and x5 in April 2022 compared to April 2021. And this is why, in the event of a disruption of Russian gas supplies, experts envisage an extremely high price, or even quantitative rationing of gas on European soil.
Other shocks
In addition to crude oil and natural gas, Russia exports coal (which is transported by ship, making it highly substitutable with other suppliers) and refined oil products, particularly diesel, for which Europe is particularly dependent, as refining capacities are specific and difficult to substitute in the short term. Russia also exports rare metals (nickel, palladium, of which it is the world's leading producer) for which substitution is delicate, and other products (fertilisers, wheat, wood, etc.) which are traded on a world market.
In addition to these supply and price shocks, Europeans have to add the loss of markets in Russia due to export restrictions, which in May will account for around 60% of the volumes exported to that country in 2021, or around 0.4 percent of European GDP. Moreover, the withdrawal of large European companies from Russian territory would represent around 1 percent of GDP in losses for the European economy according to Blanchard and Pisani-Ferry (2022).
Finally, the invasion of Ukraine could trigger precautionary behaviour on the part of households and companies in Europe, leading them to revise their investments downwards, to save more and to direct their savings towards low-risk assets. It could also increase uncertainty in financial markets. However, the depreciation of the euro (-8% against the US dollar between 23 February and 12 May 2022) could support activity in the euro area in the short term, while increasing inflationary pressures.
Transmission channels to the economy
Once the shocks have been defined, we need to look at the transmission channels to the European economies. Here we focus on the energy shock.
Crude oil
Oil price volatility is not new. In real terms, the price increase observed at the end of 2021 and the beginning of 2022 is not exceptional (Graph 4), and modellers are used to simulating the impact of such a shock.
Figure 4: Real crude oil and gas prices
(monthly data, base 100 = average 1960-2021)
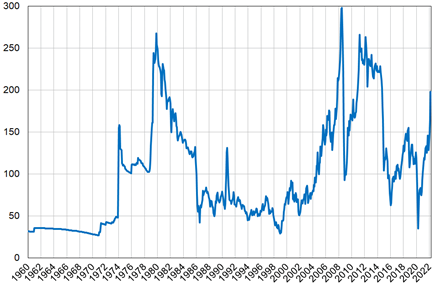
Sources: Commodity Research Bureau and Bureau of Labor Statistics.
The crude oil price is deflated by the US consumer price index. Last point : March 2022.
For a net importing country, a rise in oil prices leads to a transfer of income to the rest of the world, and thus to impoverishment. If wages do not immediately adjust to the price increase, purchasing power and thus consumption will decline in the short term. Companies, for their part, cannot immediately pass on the higher energy prices in their sales prices, so their margins shrink, to the detriment of investment. When companies raise their prices, they preserve their margins but lose market share.
However, the rise in oil prices is a global shock. As all companies face higher costs, the competitiveness effects are limited. On the other hand, falling incomes in other oil-importing countries mechanically reduce foreign demand, and thus exports. In total, an increase in oil prices of 25 dollars reduces activity by about ¼ point over 1 year in a country like France (table).
Impact on GDP of a $25/barrel oil price increase in a neo-Keynesian model
(in % deviation from a scenario without shock)
| Model | Country/area | International linkages | 1 year impact |
| Oxford Economics | Euro zone | yes | -0,25 |
| E-Mod (OFCE) | France | no | -0,25 |
| ThreeME (OFCE) | France | no | -0,29 |
| Mésange "naïve" | France | no | -0,25 |
| Mésange "Reamistic" | France | yes | -0,3 |
Source : model documentation, neglecting possible non-linearities.
Natural gas
In standard macro-econometric models, gas is not identified as such and its price is assumed to follow that of oil. A fortiori, a gas supply disruption is difficult to simulate. In these models, the production of goods and services depends on labour, capital and an exogenous total factor productivity (TFP). A disruption in the supply of imported gas could be seen as an exogenous decrease in TFP. However, in these Keynesian models, TFP is only relevant in the long run. In the short run, GDP is determined by demand, although prices respond to supply shocks.
To properly account for the disruption of value chains, one must instead use a general equilibrium model describing how the shock affects not only industries using gas directly, but downstream industries - chemicals, glass, etc.; and how it can be cushioned by substitutions and the use of imports at all levels of the value chains. Said differently, German companies can choose to import energy-intensive goods, or seek less energy-intensive substitutes. Using the Baqaee and Farhi, 2021 model, Bachmann et al (2022) calculate the effect on the German economy of a 10% drop in energy supplies (gas not being isolated but grouped with other energies), according to two methods: a simplified formula, which leads to a loss of GDP of about -1%; and a full model with international linkages, according to which the same shock reduces German GDP by only -0.3%. Due to a lower dependence on Russian gas, the same calculations for the French economy lead to more limited GDP losses, between -0.15% (full model) and -0.2% (simplified model), see Baqaee et al. (2022).
In these general equilibrium calculations, prices and wages are assumed to adjust perfectly - we are talking only about relative prices. To "compensate" for this shortcoming, the authors assume a relatively rigid production: substitutions between intermediate goods are difficult. However, in a rigid economy, the rebalancing of markets after a shock implies strong variations in relative prices, and therefore a significant economic cost when certain prices only adjust with delay. For example, companies in the glass sector fail to pass on higher costs to their customers, and some stop production.
Therefore, a combination of different approaches is needed to arrive at a realistic estimate of the effects of the energy crisis. Other elements of the crisis can then be added - falling exports to Russia, depreciation of certain assets, precautionary behaviour, public policies, etc.
Orders of magnitude
Having identified the main methodological knots, we can now better understand the differences between the various figures that have been circulated, a sample of which is summarised here. The economic cost of the crisis is all the greater when (i) the energy price hypothesis is high, (ii) macro-Keynesian effects are taken into account, and (iii) the productive fabric is rigid.
Blanchard and Pisani-Ferry (2022) estimate the drain on European incomes due to a 25% increase in the price of imported oil and gas at around 1 point of GDP. This figure is consistent with the IMF's revised growth forecast for 2022 (Graph 1). It constitutes a form of hard core economic cost of the war to date for Europeans - a cost that could increase as a result of higher prices, supply disruptions, unfavourable international spillovers, wealth effects or more cautious behaviour on the part of households and businesses. If the energy crisis is temporary, governments will be able to mitigate its effects. However, if the crisis lasts, the loss will have to be progressively distributed among the various economic agents.
***
Read more:
>> Version française : Crise énergétique : vers une Europe à la chandelle
>> All posts by Agnès Bénassy-Quéré, chief economist - French Treasury