Poverty, purchasing power, employment: statistics tested in everyday life
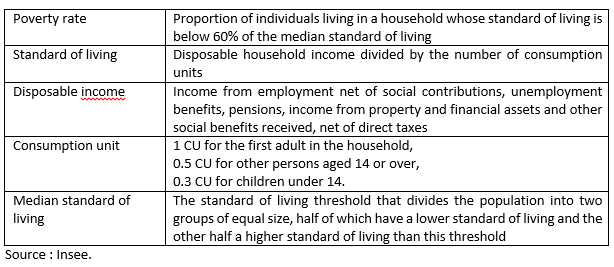
On November 3rd, INSEE published a first estimate of the monetary poverty rate for 2020: 14.6%, the same level as in 2019, one of the lowest among European countries (see table 1 for the calculation of the poverty rate).
Table 1: Calculation of the income poverty rate
In autumn 2021, the median standard of living in 2020 is not yet known. In 2019 it was 1,837 €/month per consumption unit, according to INSEE. Assuming that it has evolved in 2020 in line with the average disposable income (+1%), it would be €1,855/month in 2020 and the poverty line would be €1,113/month per consumption unit. A quick reminder: this threshold is calculated after social transfers received (active solidarity income, in-work benefits, housing benefits, family benefits).
For sure, one cannot be satisfied with a poverty rate close to 15%. In France, the minimum wage (Smic) is relatively close to the median income, so that situations of poverty are often the result of unstable or part-time employment, combined with a difficult family situation and/or, sometimes, the non-use of benefits. According to the Conseil d'analyse économique (2017), means-tested social benefits make an important contribution to reducing income poverty. However, access to stable employment affects several dimensions of poverty, including social isolation (see the ATD Fourth World and Oxford University report, 2019 on the multiple facets of poverty, and INSEE surveys on material and social deprivation).
Poverty through two crises
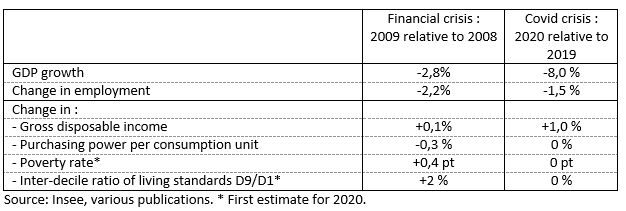
In times of crisis, it is particularly important to protect the poorest households, who cannot draw on their savings to overcome temporary income losses. The exceptional support granted to low-income households during the pandemic contributed to this (see my December 2020 post). Indeed, the stability of the poverty and inequality rates during the 2020 crisis, if confirmed, contrasts with their increase during the previous crisis, whereas the fall in GDP was much more marked in 2020 than in 2009 (table 2).
Table 2. Two crises compared: 2009 and 2020
In his recent blog post, Jean-Luc Tavernier, the Director general of Insee, explores the reasons behind the gap between the statistics (preservation of purchasing power for all income deciles during the crisis, confirmed by the analysis of the anonymised accounts of more than 200,000 La Banque Postale customers), and the "perception" of households. In addition to the issue of undeclared income which, by construction, escapes public statistics, he suggests that for some people, poverty may have intensified without the numbers increasing.
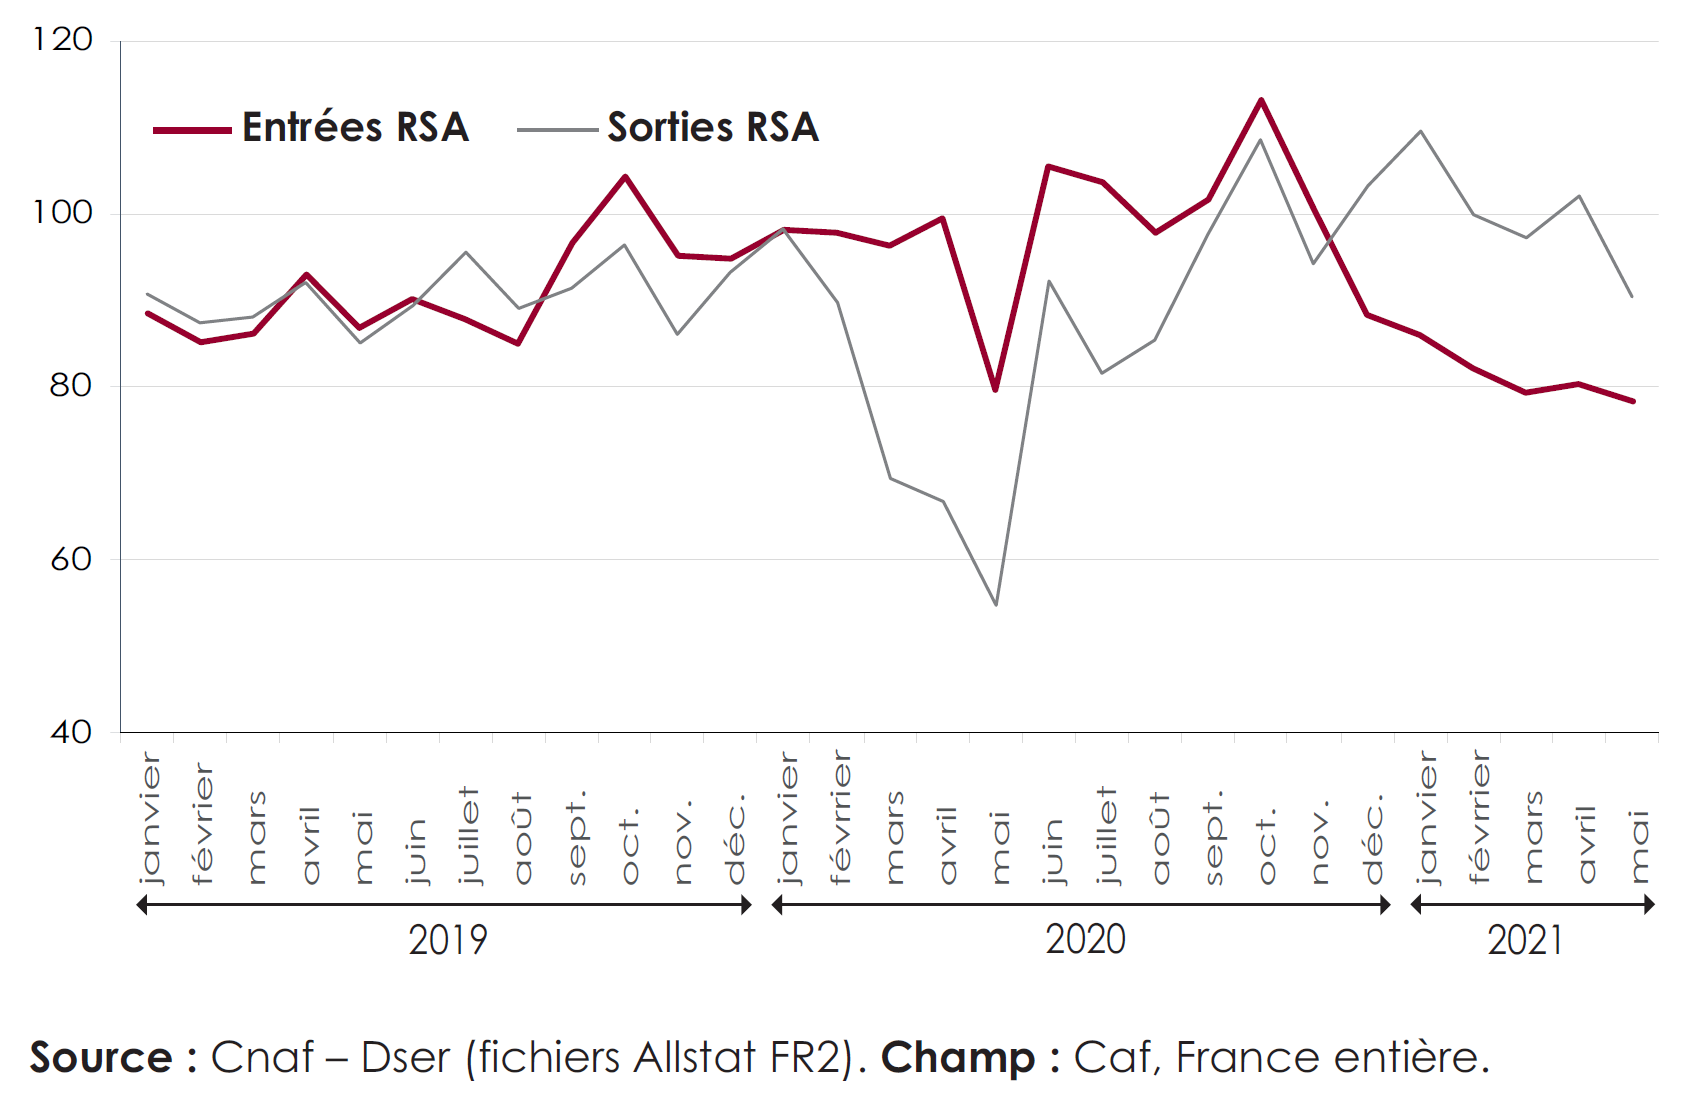
One explanation could be that the crisis has frozen disparate situations. For example, the number of minimum income beneficiaries (Revenu de Solidarité Active - RSA) increased in 2020 due to an abnormally low number of exits from the system rather than an increase in entries (Figure 1). Staying longer on the RSA could have had an impact on the intensity of real poverty (exhaustion of resources) and perceived poverty (lack of prospects for recovery).
Figure 1. Monthly entries in and exits from RSA (in thousands)
Source : CNAF, Estimations avancées des évolutions des foyers allocataires du RSA, juillet 2021.
Statistics and perceptions
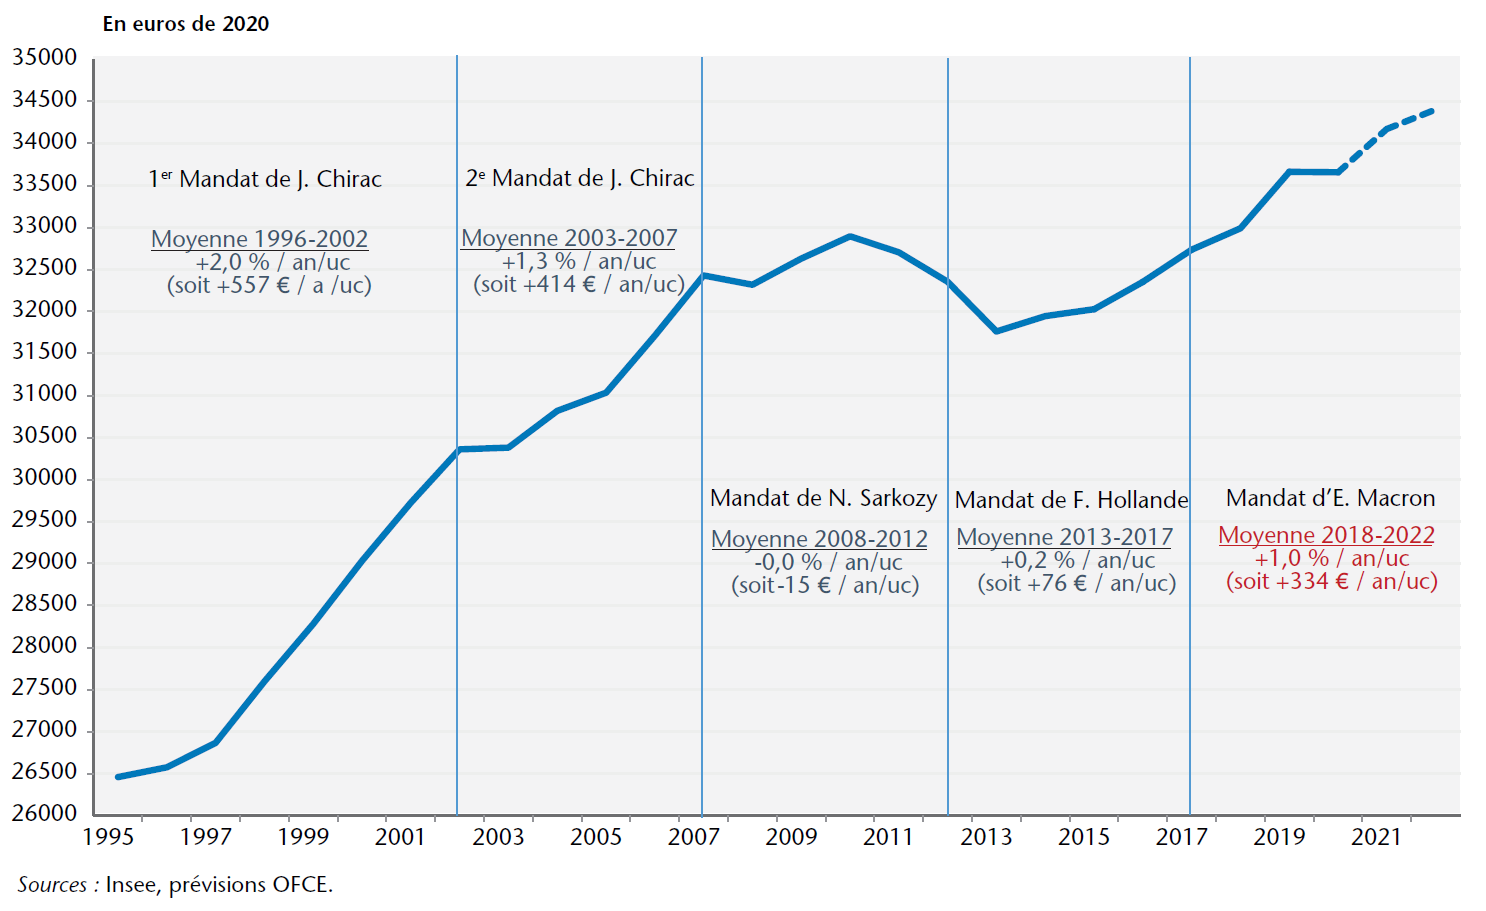
A similar gap between statistics and perceptions can be observed concerning the evolution of purchasing power over a long period. According to the OFCE, purchasing power per consumption unit will have increased by 1% per year on average over the period 2018-2022, i.e. the equivalent of €334/year per consumption unit (constant 2020 euros, see graph 2). For a family of four (2 parents, 2 children under 14), and cumulatively over 5 years, this represents an increase in purchasing power of €3,500. Why don’t people perceive this increase? An explanation may be found in rising house prices, which weigh on the budget of first-time buyers (20% of the population). Indeed, only rents are deducted from the purchasing power, but renters are only 40% of the population, and the corresponding index is less dynamic than apparent rents, which include an improvement in housing quality. Another factor is the sensitivity of low-income households to the recent rise in energy prices, which, according to the Family Budget survey, accounts for a larger share of the expenditure of the first quintile of the standard of living than that of the last quintile (the share of fuel expenditure being higher for the middle classes). Nevertheless, the impact of the rise in energy prices is greatly mitigated by various measures aimed at low-income households in particular: exceptional top-up of the energy voucher, partial freezing of gas and electricity tariffs, and an 'inflation allowance'.
Figure 2. Purchasing power of households per consumption unit
Source : OFCE, octobre 2021.
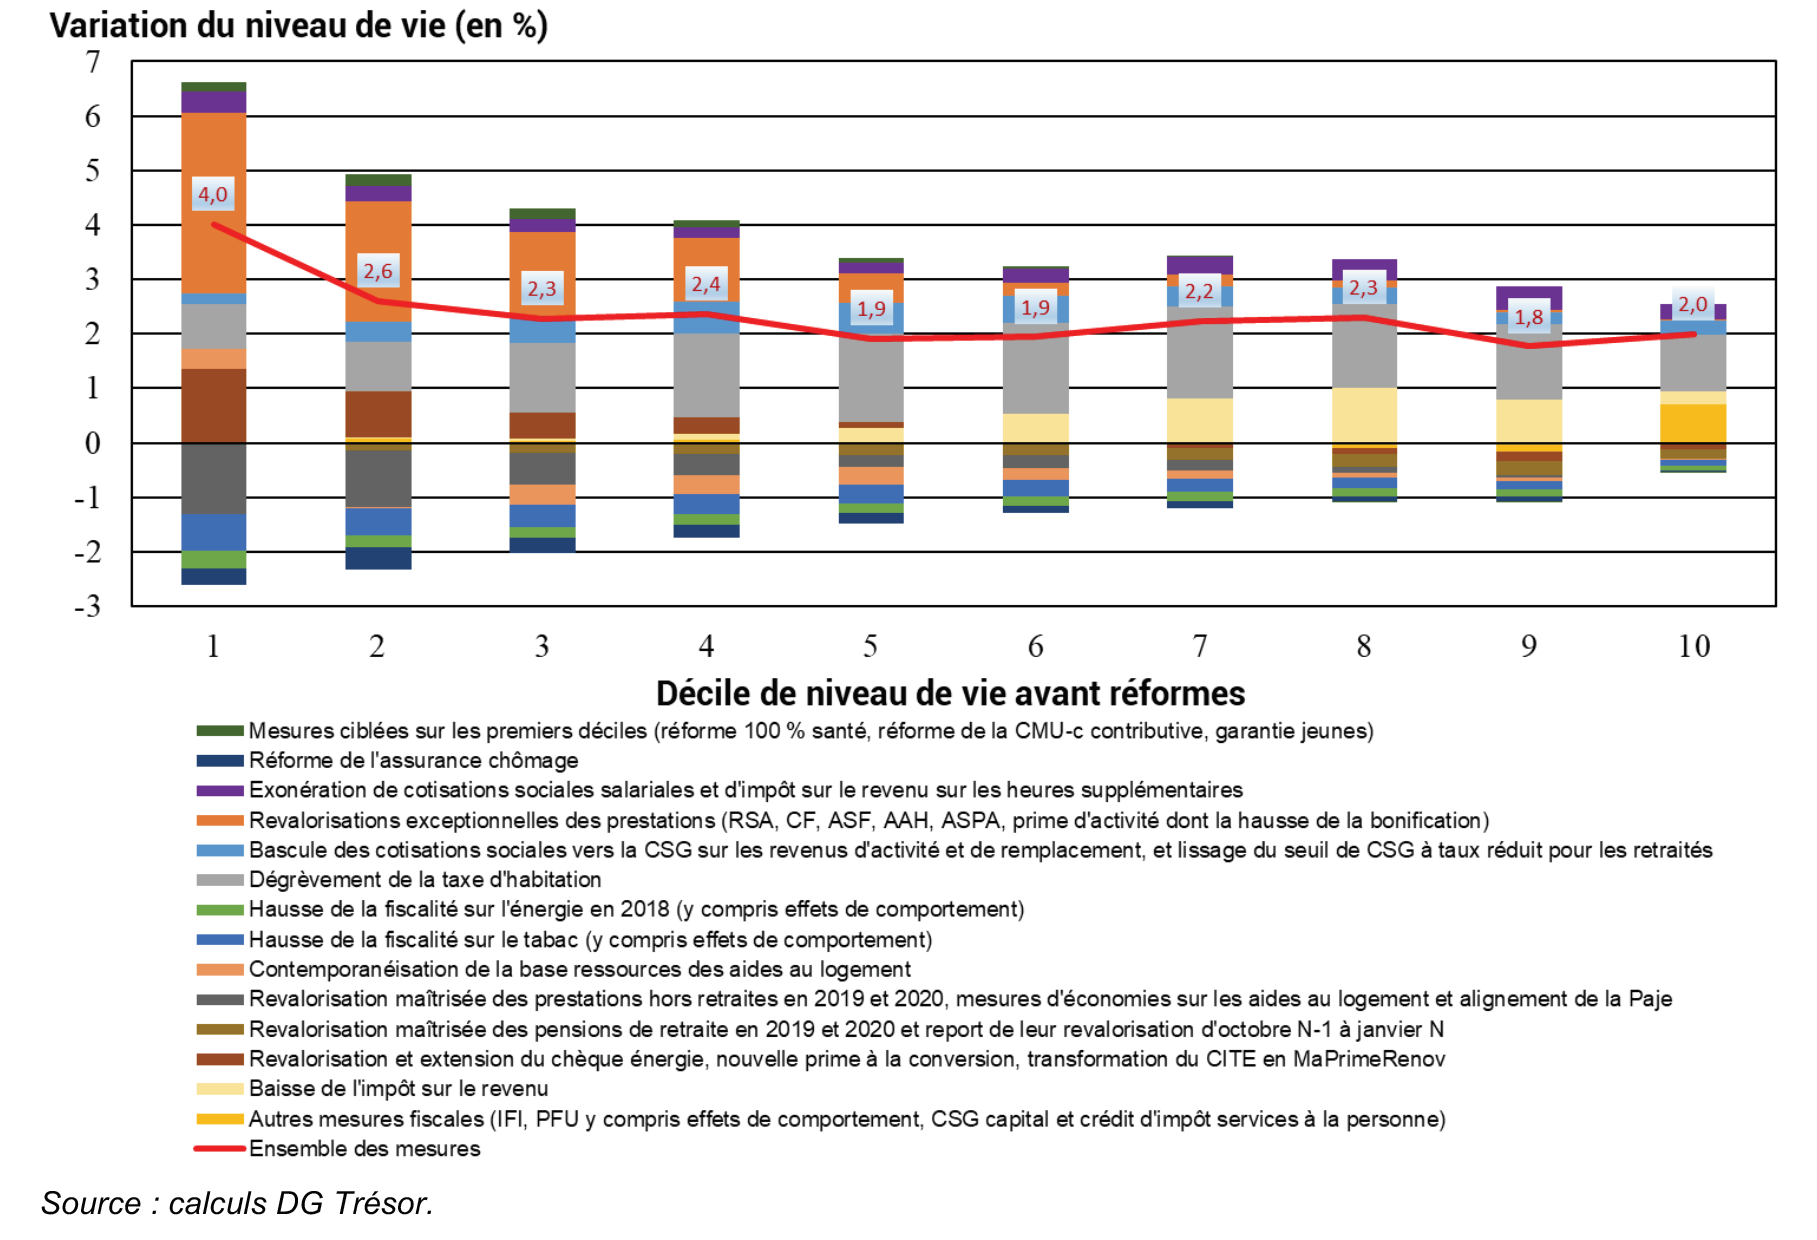
To understand the perception of households, we may also need to turn to behavioural economics. For example, Thaler (1980) and Kahneman and Tvsersky (1983) show that individuals behave differently depending on whether they are acquiring or disposing of a good, and that they also have a particular aversion to losses. If a public policy combines, as it is the case over the period 2018-2022, measures that are favourable to disposable income (gradual scrapping of the residence tax, increase in the in-work benefit, etc.), and unfavourable measures (increase in tobacco taxation, reform of housing allowances), it is possible that the unfavourable measures will be given greater weight in the minds of households than the favourable measures, even when the latter outweigh the former in quantitative terms for all deciles of the standard of living, and in particular for those at the lower end of the scale (Figure 3).
Figure 3. Redistributive balance of permanent measures implemented over the period 2018-2022
Employment
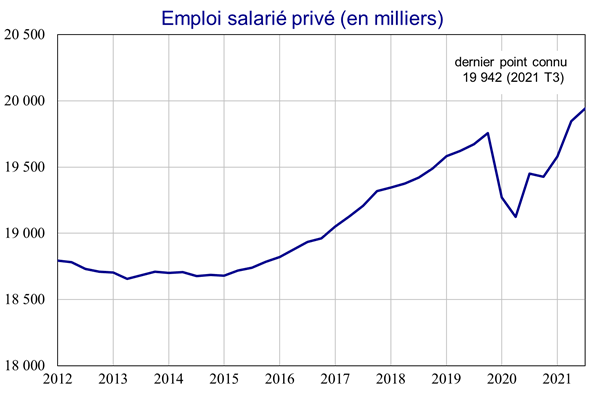
Poverty is not limited to the monetary dimension. Employment - particularly stable employment - which is strongly correlated with poverty in its various dimensions, is therefore probably a good indicator. The first estimate of employment in Q3 2021 confirms the strong rebound since the beginning of 2021. Employment has now exceeded its pre-crisis level, while the number of hires on contracts of more than one month (including permanent contracts but excluding temporary work) has also been rising for several quarters. In France, everyone knows people looking for a job, but also, increasingly, companies looking to hire. The labour market can be observed by everyone, and aggregate figures are known quickly. According to INSEE's monthly household survey, the fear of unemployment has fallen sharply since the beginning of 2021. The employment figures are therefore, if not consensual, at least understood in a relatively homogeneous way, which is the basis for a good debate.
Figure 4
Source : Insee, novembre 2021.
***
Read more:
>> Version française : Pauvreté, pouvoir d'achat, emploi : la statistique à l'épreuve de la vie quotidienne
>> All posts by Agnès Bénassy-Quéré, chief economist - French Treasury
