Public support to low-income households in covid times in France
In many ways, the pandemic has affected households more severely at the lower end of the income scale: they frequently work in sectors particularly affected by the crisis, such as restaurants and transport; they often work on short-term contracts, and their occupations can hardly be teleworked; finally, they had to face additional food expenses when school canteens were closed. While no one disputes this reality, quantification remains difficult.
Struggling with the statistical apparatus
Insee's economic outlooks have now accustomed us to tracking consumption, mobility and electricity consumption on a weekly basis. After the first lockdown, it quickly became clear that consumption was rebounding strongly. During the second lockdown, it was quickly known that the economy would be less penalized. The success of the Black Friday was also disclosed quickly. Such acceleration of macroeconomic analysis comes in sharp contrast with the delays of the statistical apparatus in social matters.
The Department of Research, Studies, Evaluation and Statistics (DREES) of the Ministry of Health and Social Affairs has just published an estimate of the change in the number of beneficiaries of the social inclusion benefit (RSA) since the start of the crisis. From now on, it will publish a monthly update, which will speed up the identification of social distress. According to DREES, between October 2019 and October 2020, the number of RSA beneficiaries has increased by around 8.5%. This figure is in line with the decline in activity in 2020, estimated at -9% by the latest forecasts of the Banque de France in Dec. 2020. In a November note, the family branch of the Social-security system, however, attributed the increase in the number of beneficiaries mainly to a sharp slowdown in exits from the system: for obvious reasons, existing beneficiaries have had more difficulty than in the past finding a job. While being a long-term beneficiary of the RSA is certainly not an enviable prospect, the figures so far do not seem to show that a larger number of households have fallen into precariousness as a result of the crisis than is usually the case.
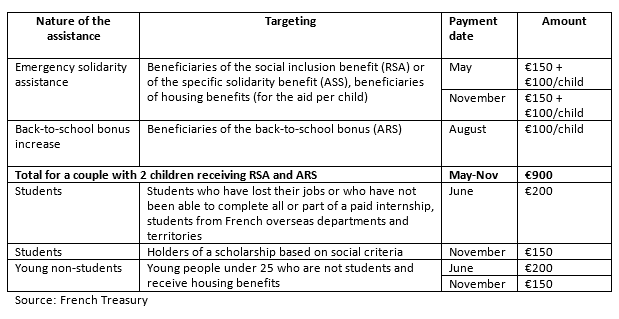
Another way to look at the situation of low-income households is to rely on surveys. The first wave of the EpiCov survey, carried out jointly by Insee, Inserm and DREES (135,000 people surveyed in May 2020), indicates that, among the poorest 10% of households, 35% declare a deterioration of their financial situation during the first lockdown, against 23% for all those questioned and only 16% for the top decile. The survey also highlights great inequality by age: young workers were hardest hit by the first lockdown. However, these ratios do not take into account the extent of the loss of income or, by construction, the emergency assistance received between May and November (see table below). According to the latest Insee Conjoncture in France, aggregate gross disposable income of households fell by 3.3% in the first half of 2020 but could rebound by 4.1% in the second half. Thus, according to Insee, over the year as a whole, household income would be preserved on average.
Table. Emergency assistance to low-income households in France, year 2020
To overcome the lack of high-frequency social data, the Council of Economic Analysis (CAE), in cooperation with a large banking network, has studied anonymized consumption data paid by credit cards as well as the evolution of 300,000 bank accounts between February and August 2020. Assuming that the first decile of the population was also, before the crisis, the first decile in terms of spending on credit cards, the CAE shows that the consumption of low-income households fell less than the average during the first lockdown and that it rebounded more afterwards. Consistently, the savings of low-income households (measured by the change in their different bank accounts net of changes in debt with the same banking network) decreased, while wealthy households saved.
Absent of high-frequency data on household income, however, it remains difficult to quantify in "real time" the impact of the crisis on the situation of low-income households. Indicators such as the drop in the number of over-indebtedness applications at the Banque de France on the one hand, and the lengthening of the lines at food banks on the other hand, make it difficult to draw up a coherent picture. The decline in informal work may have contributed to blurring the statistical picture, but such assumption is by definition difficult to validate and quantify.
An ex ante analysis by micro-simulations
In the absence of "real" data observed during the crisis, we must fall back on ex ante analysis by micro-simulations. This is what the Institute of Public Policy (IPP) has done, using the TAXIPP 2.0 model. First, the IPP has shown that low-income households are the most exposed to the crisis because of their professional situation, their occupation and their sector of activity. Then it has simulated the impact of the emergency assistance measures on households income, based on 2019 income. The IPP finds that the various targeted transfers (see table above) have raised the average annual income of the first twentieth in terms of living standards by more than 5%. They have raised the income of the next twentieth by 2.6%, the effect diminishing rapidly for higher twentieths. The IPP also finds marked redistributive effect of the solidarity fund (which has supported individual entrepreneurs), while short-time work has rather supported the middle class. All in all, the support measures appear to be heavily targeted to households with the lowest living standards.
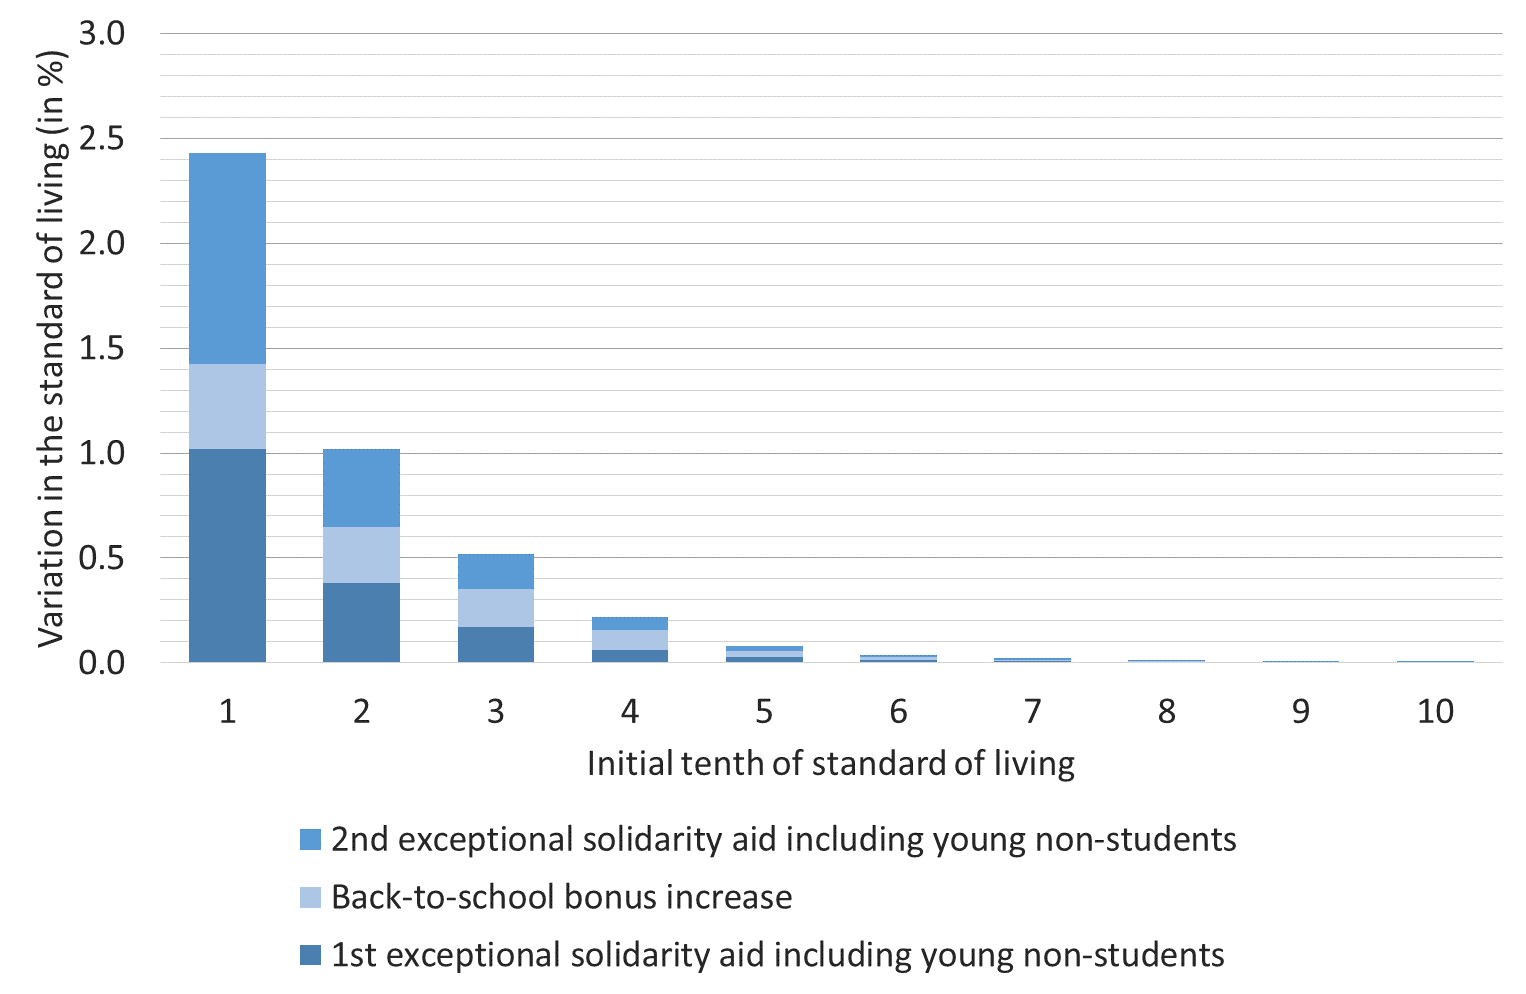
These results are consistent with the micro-simulations carried out by the French Treasury based on the Saphir 2019 model, even though the two exercises are not identical. According to these simulations, emergency assistance mentioned in the table has raised the average living standard of the first decile by 2.4%, and by 1% that of the second decile. It should be reminded here that the standard of living adjusts the disposable income for the composition of the household. The figure below shows that the support was well targeted towards the most precarious households. Over a third of the households benefiting from the support were in the first decile of the population in terms of living standards, and nearly two-thirds in the first two deciles.
Figure - Impact of the emergency support on households’ living standards, by deciles of living standard before the crisis
(in % of living standards in 2019)
Source: Saphir 2019 model, enriched with 2020 legislation, excluding variations in income and measures related to Covid-19.
Reading note: the emergency measures (excluding students) have increased the living standards of households in the first decile (both beneficiaries and non-beneficiaries) by an average 2.4%.
Excluded from the analysis, students have been particularly affected by the crisis: many of them have lost their part-time job or the internship. Targeting support to them is particularly difficult because socio-fiscal data does not capture intra-family transfers in favor of students – although these transfers constitute more than half of their income on average. The emergency assistance that they received in June and November was targeted towards students benefiting from social aids and scholarship holders.
Other measures have been taken in the context of the crisis to fight poverty, such as strengthening emergency accommodation or support to NGOs. Now, the French recovery plan foresees a wide range of tools to foster integration of young people into the labor market (hiring bonuses, subsidized jobs, extension of civic service). Employment remains the best bulwark against poverty, and a delayed entry into employment are likely to weigh on new generations of workers for years.
Read more :
>> Version française : Ménages modestes : impact des mesures de soutien exceptionnelles
>> All posts by Agnès Bénassy-Quéré, chief economist - French Treasury


