3-6-12: French firms through the Covid storm
Should you take home only three figures out of the just-released working paper by Benjamin Hadjibeyli, Guillaume Roulleau and Arthur Bauer on French firms during the covid crisis, these could be: 3-6-12:
- 3% is the proportion of French firms that would have become insolvent (meaning that the value of their debt would have exceeded the value of their assets) from March to December 2020 even without the crisis, while they were solvent before the crisis;
- 6% is the proportion of French firms that would have become insolvent during the same period, accounting for the impact of the crisis and the public support measures;
- 12% is the proportion of French firms that would have become insolvent during the same period, accounting for the impact of the crisis, if there had been no public support.
Hence, the crisis is expected to have roughly doubled the number of newly insolvent firms from March to December 2020. Without public support, though, this number would have quadrupled. Another way to understand these figures is that public support is likely to have halved the number of firms becoming insolvent over this period.
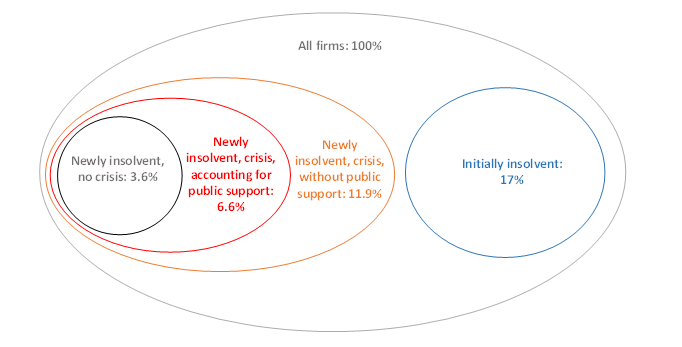
Of course these are rounded numbers. The exact simulation results are reported in Figure 1. Given the many assumptions that the authors had to make for this exercise, though, 3-6-12 can be accepted as an approximation.
Figure 1. Microsimulation results for French firms over March-December 2020
Reading: amongst all firms, 11.9% would have become insolvent over March-December 2020 without public support, a proportion that shrinks to 6.6% thanks to public support received, to be compared to the 3.6% in the counterfactual of no crisis. 71.1% of all firms remain solvent in all scenarios.
Source: adapted from Hadjibeyli, Roulleau and Bauer (2021).
Importantly, insolvency is a signal of financial distress but does not necessarily involve bankruptcy. As a matter of fact, 17% of firms (mostly young companies) were already insolvent before March 2020. As for newly insolvent firms, they may not be short of cash, or their debts may be restructured, or they may nevertheless receive additional funding when activity resumes, or they may be taken over by a group. Conversely, solvent firms can go bankrupt if they become illiquid (i.e., if they run out of cash to meet their current obligations). These distinctions will be crucial for the phasing out of emergency support, which will need to avoid both the risk of excess liquidations and that of a “zombification” of the economy due to the debt overhang.
Microsimulations
These new results are derived by simulating the financial statements of 1.8 million non-financial firms (82% of French firms value-added) over the course of 2020. Turnovers are measured through individual monthly VAT records. Firms react to negative shocks by reducing their payroll, through short-time work, non-renewal of short-term contracts or layoffs. Observed data are used up to June 2020 (turnover) or September 2020 (payroll). For the rest of the year, the simulations rely on sector-level data and on a number of assumptions. Specifically, firms are supposed to partially adjust their variable costs, whereas they cannot adjust their fixed costs.
Public support consists in short-time work (compensation for the wages of workers who cannot work – 84% of the worker's net wage with a floor at minimum wage, with firm-level take-up data up to September), direct subsidies through the “solidarity fund” (a subsidy scheme for SMEs particularly affected by the crisis, with firm-level data up to November), tax deferrals (only employer’s social contributions in the simulation, firm-level data up to October) and tax reliefs (employer’s social contributions for firms particularly affected by the crisis, fully simulated). When individual take-ups data are missing, the grants are simulated based on the eligibility criteria.
When costs exceed revenues, a firm is supposed to first exhaust its cash, and then to borrow. It is assumed that, thanks in particular to state-guaranteed loans, firms are not subject to credit constraints. Hence, they accumulate debts when they run out of cash. When debts exceed assets, a firm is deemed insolvent.
In the simulations, it is assumed that, without public support, firms would have had similar behaviour in terms of layoffs. In particular, they would have kept in their payroll the employees that in fact were put in partial activity. This assumption is probably extreme, since layoffs would have been much larger without the short-time work scheme. In the absence of any reliable guideline to estimate firms’ counterfactual behaviours, the choice was made to rely on an overly simple but transparent assumption. Hence, over March-December 2020, the 12% figure probably somewhat overestimates the number of French firms that would have become insolvent without public support: some of them could have survived by laying off employees. It nevertheless provides an order of magnitude of the proportion of firms at risk of massive layoffs, restructuring or (ultimately) liquidation.
Heterogeneity
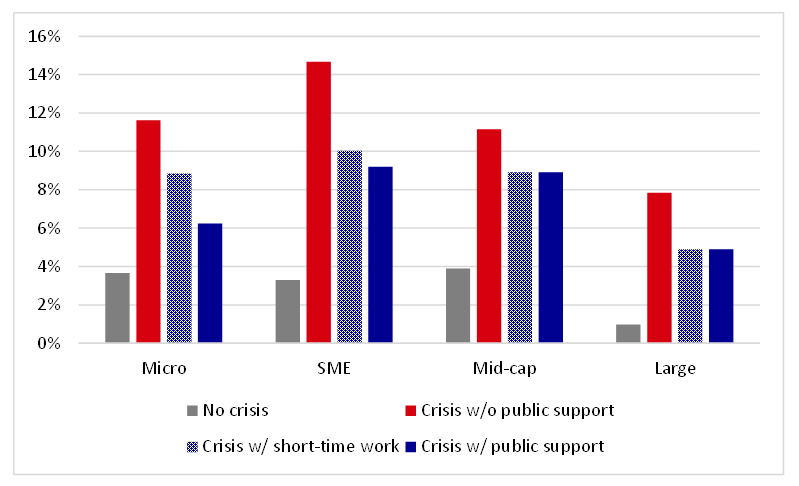
Which form of public support has made the difference? According to Figure 2, large firms and mid-caps seem to have benefited mainly from short-time work: the proportion of newly insolvent firms is similar with the whole set of public support schemes (blue bars) as with short-time work only (hatched blue bars). In contrast, very small firms have benefited relatively more from the solidarity fund and from tax reliefs.
Figure 2. Share of newly insolvent firms by size
(in percent of all firms)
Source: Hadjibeyli, Roulleau and Bauer (2021).
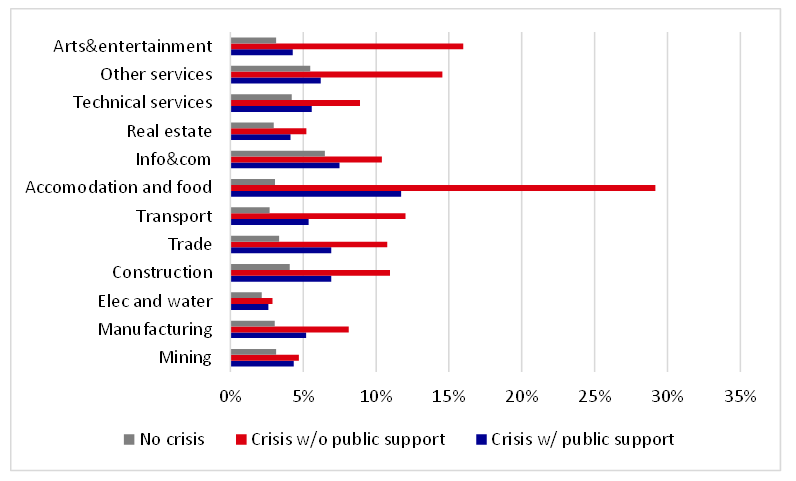
Unsurprisingly, accommodation & food is the most severely hit sector (Figure 3). Without public support, almost 30% of firms in this sector would have become insolvent between March and December 2020. With public support, this share falls dramatically. Information & communication is in a very different situation, with relatively high insolvency rate in normal times and not much more as a result of the crisis.
Figure 3. Share of newly insolvent firms by sector
(in percent of all firms)
Source: Hadjibeyli, Roulleau and Bauer (2021).
Cleansing
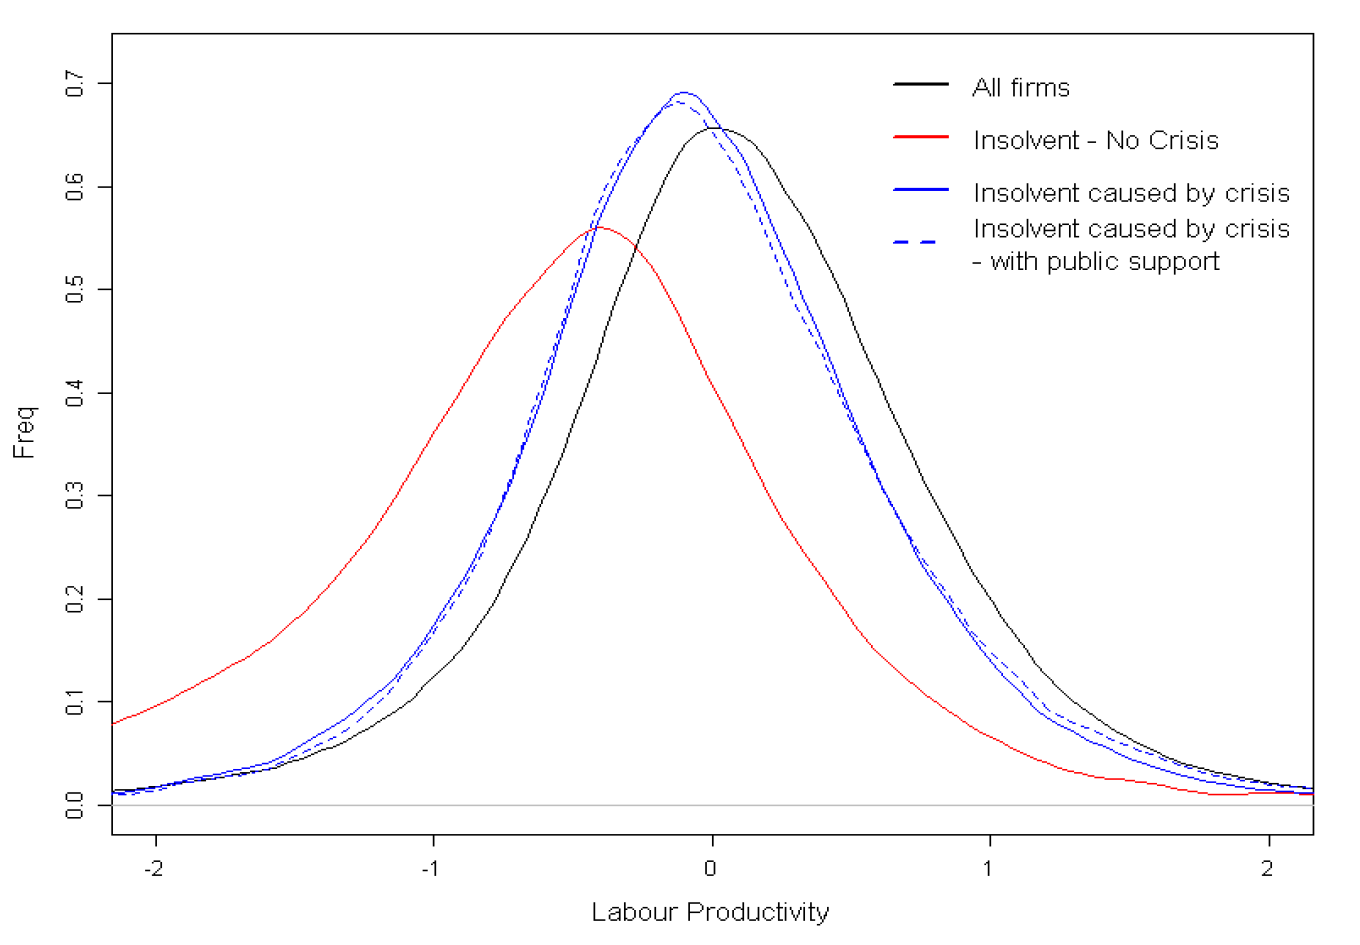
The simulations also provide an insight on potential cleansing effects of firm exit. Figure 4 plots the distribution of labour productivity across initially solvent firms, after controlling for firms’ sector and size. In normal times, newly insolvent firms are on average less productive than the average firm: the red line peaks at a lower level of productivity than the black line. With the crisis, insolvent firms are still less productive than the whole sample, but the gap is reduced: the blue lines peaks in-between the red and the black ones. Hence, the cleansing effect is still there, but it is less effective than in normal times. Note that public support does not distort the distribution of newly insolvent firms: it does not systematically protect more productive nor less productive firms (solid and dotted blue lines are almost coincident), likely because the support was provided very broadly.
Firms have been affected differently by the crisis depending on their sector and size. For instance, firms in the accommodation & food sector are typically less productive than manufacturing companies, and smaller firms are generally less productive than larger firms. This composition effect could add to the cleansing effect and raise aggregate productivity. However, this is only a short-term effect. The distribution of activity across sectors after the crisis is still extremely uncertain. Furthermore, aggregate productivity will also depend on new entrants. Replacing food services by healthcare may not raise aggregate productivity.
Figure 4. Distribution of labour productivity (in log) across initially solvent firms
(controlling for sector and size)
Note: The sample is restricted to firms with at least one employee and excludes initially insolvent firms. The black line represents the distribution of labour productivity for the whole economy. The red line represents the same distribution for the subsample of firms becoming insolvent between March and December 2020 without a crisis. The solid blue line shows the distribution for the subsample of firms becoming insolvent with the crisis but without public policies. The dashed blue line shows the same distribution but accounting for public policies (short-time work, payroll tax deferral, tax relief, SMEs Solidarity Fund).
Source: Hadjibeyli, Roulleau and Bauer (2021).
Debt overhang
In the simulations, firms borrow either to roll over their maturing debt (in which case, the stock of debt stays unchanged) or to cover their new liquidity needs once they have used up their cash reserves (this borrowing increases the stock of debt). The additional debt may push a firm into insolvency, or just result in a deterioration of its balance sheet. Under this assumption, it is estimated that, from March to December 2020, non-financial firms would have borrowed €72 bn to cover their liquidity needs in normal times. This number doubles (€148 bn) with the crisis, accounting for the subsidies received.
Even though corporate investment is mostly driven by demand which is expected to rebound, a debt overhang can weigh on investment (see Kalemli-Özcan et al. (2019) for instance). Thanks to an econometric modelling of the reaction of corporate investment to firms’ indebtedness, the simulations suggest that, even if demand and profits get back to their pre-crisis level, the new debt caused by the crisis could translate into a 2% reduction in tangible investment compared to its pre-crisis trend. Various components of the French recovery plan aim at counteracting this effect to avoid long-term scars to the capital stock. In particular, permanent cuts on production taxes will support firms’ margins, while quasi-equity injections (prêts participatifs and obligations Relance) will contribute to strenghtening their balance sheets.
>> This work was carried out for and presented to the Committee for the Monitoring and Evaluation of Support Measures for Companies Confronted with the Covid-19 Epidemic chaired by Benoit Coeuré > Link to the report (in French)
Read more :
>> Version française : 3-6-12 : Les entreprises françaises dans la tempête Covid
>> All posts by Agnès Bénassy-Quéré, chief economist - French Treasury
