Lockdown #1– Lockdown #2
When faced with a new problem, one tried and true method is to return to a known problem. How much will the November lockdown cost in terms of GDP losses? Let's look at what happened in April and think about it on the margins.
April’s standard
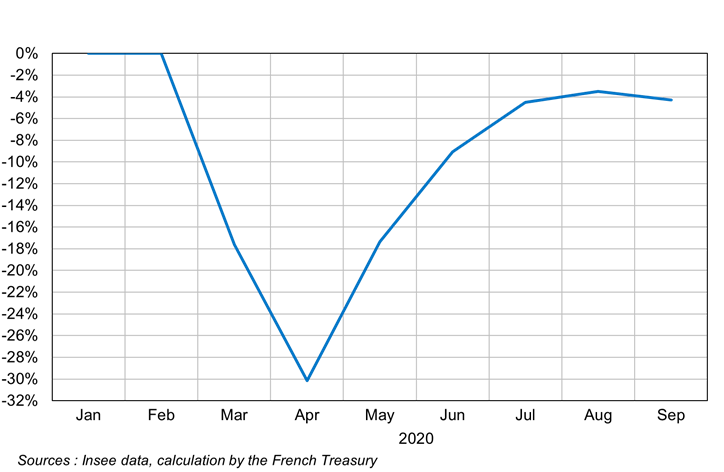
The first lockdown lasted 8 weeks between mid-March and mid-May. In the middle of this period, the month of April constitutes a reference point since the whole month was concerned, with rules invariant during the month. It was a very strict shutdown. The economic consequences were not long in coming: activity plunged by 30% compared to the pre-crisis period, before a fast recovery in end-May, June and July (Figure 1).
Figure 1 - Monthly GDP scenario
Source : Insee, calculs DG Trésor.
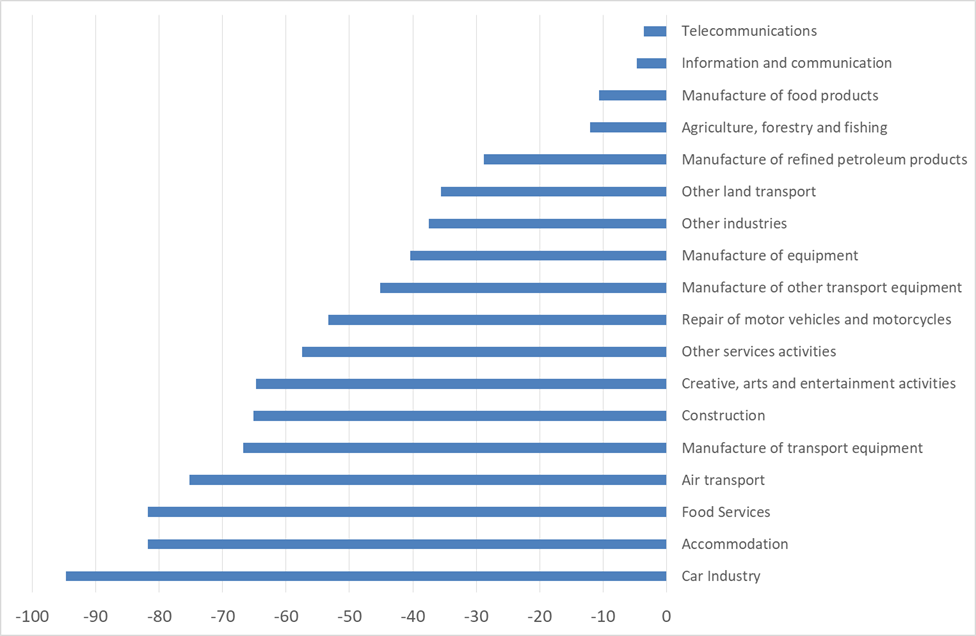
Unsurprisingly, the fall in activity was very uneven across sectors in April: very strong in restaurants, accommodation, air transport, the automotive industry, culture and recreational activities, construction; much less in agribusiness or information and communication (Figure 2). These different sectors have varying weight in the economy and the result was a 30% decline in activity compared to the pre-crisis period.
Figure 2: activity losses by sector in April 2020, in % compared to normal
Source : Insee
The Dares Acemo-Covid survey identifies 4 major causes of the decline in activity in April: administrative closures, loss of business opportunities, unavailability of staff and, finally, supply difficulties. These difficulties have played out in different ways depending on the sector. For instance, restaurants and retail trade suffered mainly from administrative closures and travel restrictions, while their suppliers (such as wine, textiles or business services) lost outlets. The construction sector suffered particularly from supply difficulties (construction materials and protective devices). Finally, non-market services were constrained by the absence of staff forced to stay home for health reasons.
Projections for the second lockdown
The second lockdown announced on October 28th differs from that of April in four major aspects. First, schools will remain open, which should allow parents of young children to continue their activity on site or by remote working. Second, remote working is now a well-established practice in companies, and employees are equipped: according to Dingel and Neinman (2020) around 37% of jobs are “teleworkable” in France. Third, sanitary protocols are also in place at production sites, and protective equipment is available: activity should be preserved in sectors such as construction or manufacturing. Finally, public services will remain open and business travel will not be restricted.
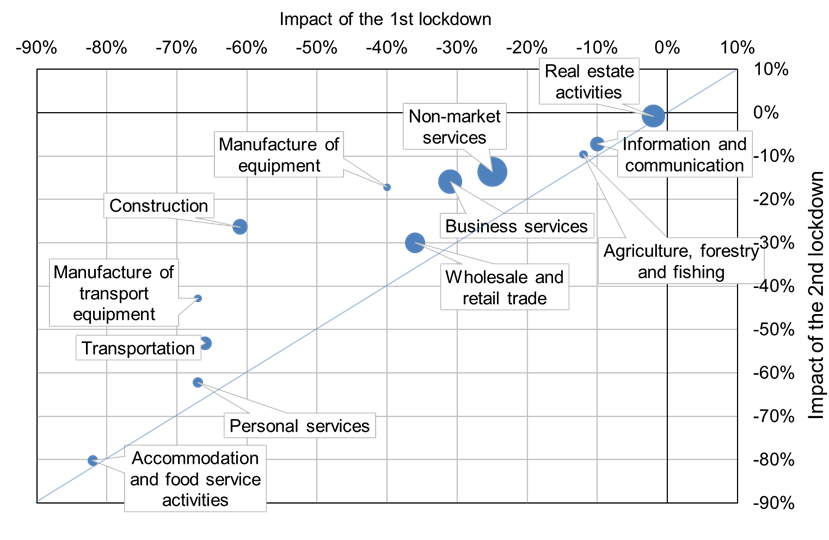
These new conditions should mitigate the impact of this new lockdown compared to that of April. To assess their intensity sector by sector, the French Treasury has analysed the results of the Acemo-Covid survey and applied an attenuation coefficient for each constraint. For instance, the impact of administrative closures is assumed to be similar to what was observed in April for the accommodation-catering, retail trade and recreational activities. Conversely, personnel and supply constraints are greatly alleviated in all sectors, while the losses of outlets are still present but somewhat attenuated. These new constraints are then applied to the activity losses observed in April to obtain the expected losses for each sector in November compared to a normal situation. The result is summarized in figure 3.
Figure 3: Impacts of lockdown#2 (y-axis) compared to lockdown#1 (x-axis)
Source: French Treasury, using data from Insee and Dares. The size of the dots represents the weight of the different sectors in GDP.
The sectors on the oblique line are those for which comparable losses are expected in November compared to April. These may be sectors hit hardly by the restrictions (accommodation and catering) or, on the contrary, little affected sectors (agriculture). The areas above the line are those that should suffer less in November than in April. We note in particular the case of construction, whose activity had fallen by 60% during the first lockdown, and which could decline "only" by 30% during the second lockdown. No sector is below the oblique line, which means that no sector should be more affected than in April, although heterogeneity can be strong within a sector.
The last step is to multiply each loss of activity by the corresponding sector's share of GDP. The contributions from the sectors are then added to obtain the aggregate impact of the second lockdown for a month of restrictions: around −20% compared to a normal month, against −30% in April.
2020 at −11%
The INSEE figures for the first three quarters indicate achievement carry-over of "growth" of −8.3% for the year 2020: if the 4th quarter were stable compared to the 3rd, the growth for the year would be -8.3%. Unfortunately, the second lockdown should lead to a decline in GDP in the 4th quarter compared to the 3rd.
In October, the economy was operating about 5% below normal. In November, the 20% drop compared to normal (due to second lockdown) therefore amounts to a 15% drop compared to October. A month of lockdown followed by a period during which severe restrictions would continue to weigh on the economy would result in a reduction of about 2.5 points in annual growth. The growth forecast for the year 2020 is finally obtained by adding the carry-over of the 3rd quarter (−8.3%) and the expected loss in the 4th quarter (−2.5%, October having been stable compared to September ), so around −11% in total for the whole of 2020 compared to 2019.
Read more :
>> Version française : Confinement-Reconfinement
>> All posts by Agnès Bénassy-Quéré, chief economist - French Treasury


